Soviet Union vs Immigrants from North Macedonia No Vehicles in Household
COMPARE
Soviet Union
Immigrants from North Macedonia
No Vehicles in Household
No Vehicles in Household Comparison
Soviet Union
Immigrants from North Macedonia
17.4%
NO VEHICLES IN HOUSEHOLD
0.0/ 100
METRIC RATING
320th/ 347
METRIC RANK
10.6%
NO VEHICLES IN HOUSEHOLD
34.6/ 100
METRIC RATING
190th/ 347
METRIC RANK
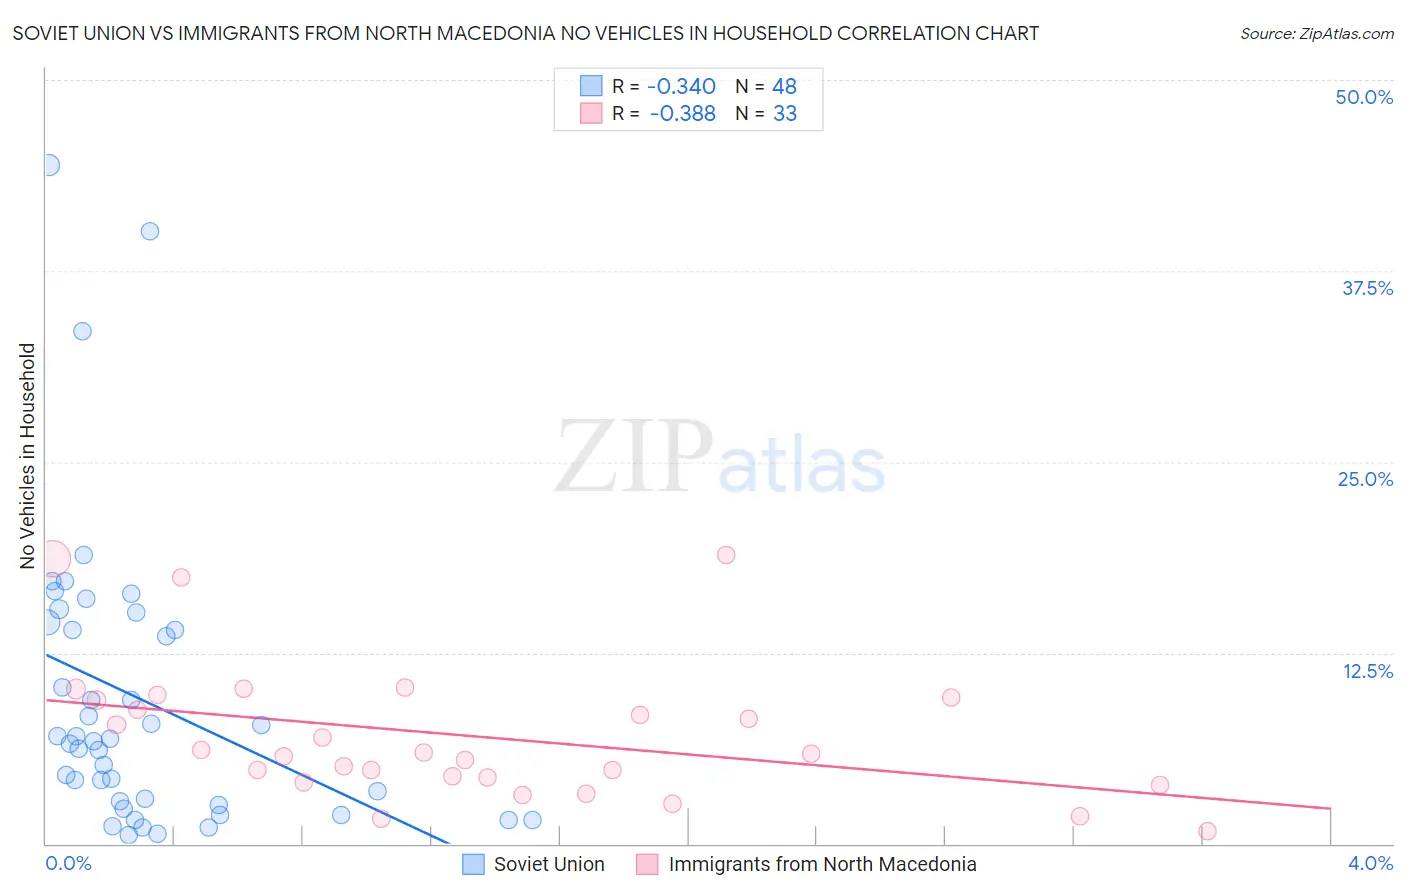
Soviet Union vs Immigrants from North Macedonia No Vehicles in Household Correlation Chart
The statistical analysis conducted on geographies consisting of 43,483,285 people shows a mild negative correlation between the proportion of Soviet Union and percentage of households with no vehicle available in the United States with a correlation coefficient (R) of -0.340 and weighted average of 17.4%. Similarly, the statistical analysis conducted on geographies consisting of 73,975,262 people shows a mild negative correlation between the proportion of Immigrants from North Macedonia and percentage of households with no vehicle available in the United States with a correlation coefficient (R) of -0.388 and weighted average of 10.6%, a difference of 64.0%.
No Vehicles in Household Correlation Summary
| Measurement | Soviet Union | Immigrants from North Macedonia |
| Minimum | 0.54% | 0.82% |
| Maximum | 44.4% | 18.9% |
| Range | 43.9% | 18.1% |
| Mean | 9.5% | 7.1% |
| Median | 6.8% | 5.9% |
| Interquartile 25% (IQ1) | 2.7% | 4.2% |
| Interquartile 75% (IQ3) | 14.3% | 9.5% |
| Interquartile Range (IQR) | 11.6% | 5.3% |
| Standard Deviation (Sample) | 9.6% | 4.5% |
| Standard Deviation (Population) | 9.5% | 4.4% |
Similar Demographics by No Vehicles in Household
Demographics Similar to Soviet Union by No Vehicles in Household
In terms of no vehicles in household, the demographic groups most similar to Soviet Union are Alaska Native (17.4%, a difference of 0.16%), Jamaican (17.9%, a difference of 2.9%), Immigrants from Belarus (16.7%, a difference of 4.1%), Immigrants from Ghana (16.6%, a difference of 5.0%), and Immigrants from Cabo Verde (18.4%, a difference of 5.8%).
| Demographics | Rating | Rank | No Vehicles in Household |
| Tohono O'odham | 0.0 /100 | #313 | Tragic 15.6% |
| Albanians | 0.0 /100 | #314 | Tragic 15.6% |
| Cypriots | 0.0 /100 | #315 | Tragic 15.7% |
| Ghanaians | 0.0 /100 | #316 | Tragic 16.4% |
| Immigrants | Ghana | 0.0 /100 | #317 | Tragic 16.6% |
| Immigrants | Belarus | 0.0 /100 | #318 | Tragic 16.7% |
| Alaska Natives | 0.0 /100 | #319 | Tragic 17.4% |
| Soviet Union | 0.0 /100 | #320 | Tragic 17.4% |
| Jamaicans | 0.0 /100 | #321 | Tragic 17.9% |
| Immigrants | Cabo Verde | 0.0 /100 | #322 | Tragic 18.4% |
| Immigrants | Yemen | 0.0 /100 | #323 | Tragic 19.5% |
| Immigrants | Caribbean | 0.0 /100 | #324 | Tragic 19.6% |
| Senegalese | 0.0 /100 | #325 | Tragic 19.8% |
| Immigrants | West Indies | 0.0 /100 | #326 | Tragic 20.5% |
| Immigrants | Senegal | 0.0 /100 | #327 | Tragic 21.1% |
Demographics Similar to Immigrants from North Macedonia by No Vehicles in Household
In terms of no vehicles in household, the demographic groups most similar to Immigrants from North Macedonia are Immigrants from Eritrea (10.6%, a difference of 0.23%), Immigrants from Northern Europe (10.7%, a difference of 0.23%), Carpatho Rusyn (10.7%, a difference of 0.38%), Immigrants from Armenia (10.6%, a difference of 0.42%), and Immigrants from Poland (10.6%, a difference of 0.54%).
| Demographics | Rating | Rank | No Vehicles in Household |
| Natives/Alaskans | 43.7 /100 | #183 | Average 10.5% |
| Immigrants | Nepal | 42.4 /100 | #184 | Average 10.5% |
| South Americans | 41.9 /100 | #185 | Average 10.5% |
| German Russians | 40.6 /100 | #186 | Average 10.5% |
| Immigrants | Poland | 38.4 /100 | #187 | Fair 10.6% |
| Immigrants | Armenia | 37.5 /100 | #188 | Fair 10.6% |
| Immigrants | Eritrea | 36.3 /100 | #189 | Fair 10.6% |
| Immigrants | North Macedonia | 34.6 /100 | #190 | Fair 10.6% |
| Immigrants | Northern Europe | 33.1 /100 | #191 | Fair 10.7% |
| Carpatho Rusyns | 32.1 /100 | #192 | Fair 10.7% |
| Ukrainians | 28.0 /100 | #193 | Fair 10.7% |
| Pueblo | 27.0 /100 | #194 | Fair 10.8% |
| Immigrants | Brazil | 26.3 /100 | #195 | Fair 10.8% |
| Central Americans | 24.3 /100 | #196 | Fair 10.8% |
| Shoshone | 24.1 /100 | #197 | Fair 10.8% |