Indian (Asian) vs West Indian No Vehicles in Household
COMPARE
Indian (Asian)
West Indian
No Vehicles in Household
No Vehicles in Household Comparison
Indians (Asian)
West Indians
14.1%
NO VEHICLES IN HOUSEHOLD
0.0/ 100
METRIC RATING
290th/ 347
METRIC RANK
23.7%
NO VEHICLES IN HOUSEHOLD
0.0/ 100
METRIC RATING
330th/ 347
METRIC RANK
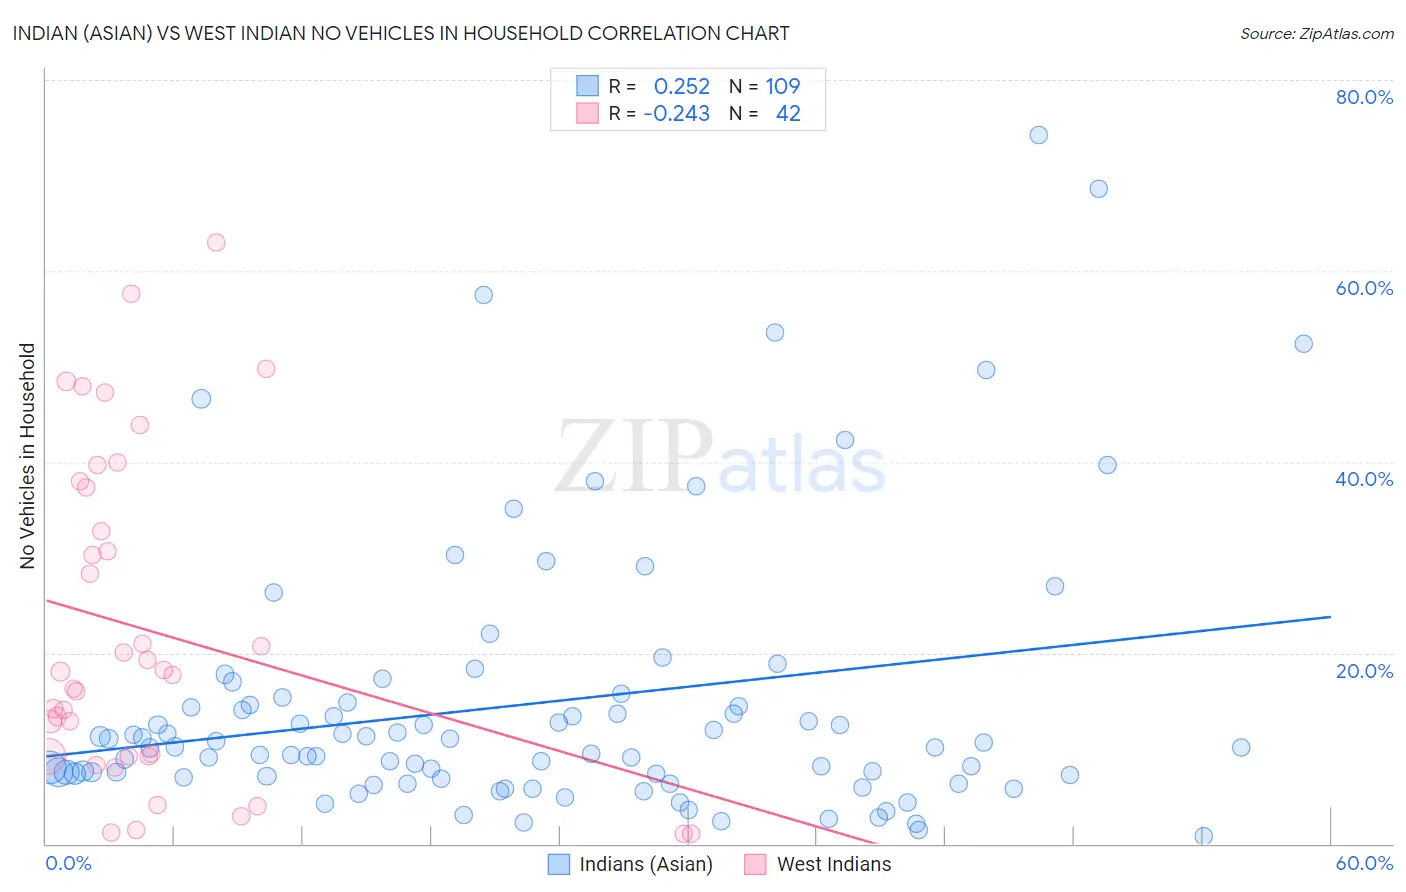
Indian (Asian) vs West Indian No Vehicles in Household Correlation Chart
The statistical analysis conducted on geographies consisting of 492,881,185 people shows a weak positive correlation between the proportion of Indians (Asian) and percentage of households with no vehicle available in the United States with a correlation coefficient (R) of 0.252 and weighted average of 14.1%. Similarly, the statistical analysis conducted on geographies consisting of 253,703,061 people shows a weak negative correlation between the proportion of West Indians and percentage of households with no vehicle available in the United States with a correlation coefficient (R) of -0.243 and weighted average of 23.7%, a difference of 68.6%.
No Vehicles in Household Correlation Summary
| Measurement | Indian (Asian) | West Indian |
| Minimum | 0.81% | 1.0% |
| Maximum | 74.2% | 63.0% |
| Range | 73.4% | 62.0% |
| Mean | 14.7% | 22.3% |
| Median | 10.1% | 17.9% |
| Interquartile 25% (IQ1) | 7.0% | 9.2% |
| Interquartile 75% (IQ3) | 14.7% | 37.3% |
| Interquartile Range (IQR) | 7.7% | 28.1% |
| Standard Deviation (Sample) | 14.2% | 17.0% |
| Standard Deviation (Population) | 14.1% | 16.8% |
Similar Demographics by No Vehicles in Household
Demographics Similar to Indians (Asian) by No Vehicles in Household
In terms of no vehicles in household, the demographic groups most similar to Indians (Asian) are Okinawan (14.1%, a difference of 0.0%), Pima (14.1%, a difference of 0.49%), Immigrants from Jamaica (14.2%, a difference of 1.1%), Immigrants from Australia (13.8%, a difference of 1.7%), and Belizean (14.3%, a difference of 1.9%).
| Demographics | Rating | Rank | No Vehicles in Household |
| Immigrants | Kazakhstan | 0.0 /100 | #283 | Tragic 13.6% |
| Immigrants | Malaysia | 0.0 /100 | #284 | Tragic 13.6% |
| Immigrants | Eastern Europe | 0.0 /100 | #285 | Tragic 13.6% |
| Colville | 0.0 /100 | #286 | Tragic 13.7% |
| Immigrants | Ireland | 0.0 /100 | #287 | Tragic 13.7% |
| Hopi | 0.0 /100 | #288 | Tragic 13.7% |
| Immigrants | Australia | 0.0 /100 | #289 | Tragic 13.8% |
| Indians (Asian) | 0.0 /100 | #290 | Tragic 14.1% |
| Okinawans | 0.0 /100 | #291 | Tragic 14.1% |
| Pima | 0.0 /100 | #292 | Tragic 14.1% |
| Immigrants | Jamaica | 0.0 /100 | #293 | Tragic 14.2% |
| Belizeans | 0.0 /100 | #294 | Tragic 14.3% |
| Paraguayans | 0.0 /100 | #295 | Tragic 14.4% |
| Immigrants | Spain | 0.0 /100 | #296 | Tragic 14.5% |
| Immigrants | Panama | 0.0 /100 | #297 | Tragic 14.6% |
Demographics Similar to West Indians by No Vehicles in Household
In terms of no vehicles in household, the demographic groups most similar to West Indians are Trinidadian and Tobagonian (23.7%, a difference of 0.18%), Immigrants from Ecuador (23.8%, a difference of 0.51%), Immigrants from Trinidad and Tobago (24.6%, a difference of 3.9%), Ecuadorian (22.8%, a difference of 4.2%), and Immigrants from Dominica (22.2%, a difference of 6.6%).
| Demographics | Rating | Rank | No Vehicles in Household |
| Immigrants | Yemen | 0.0 /100 | #323 | Tragic 19.5% |
| Immigrants | Caribbean | 0.0 /100 | #324 | Tragic 19.6% |
| Senegalese | 0.0 /100 | #325 | Tragic 19.8% |
| Immigrants | West Indies | 0.0 /100 | #326 | Tragic 20.5% |
| Immigrants | Senegal | 0.0 /100 | #327 | Tragic 21.1% |
| Immigrants | Dominica | 0.0 /100 | #328 | Tragic 22.2% |
| Ecuadorians | 0.0 /100 | #329 | Tragic 22.8% |
| West Indians | 0.0 /100 | #330 | Tragic 23.7% |
| Trinidadians and Tobagonians | 0.0 /100 | #331 | Tragic 23.7% |
| Immigrants | Ecuador | 0.0 /100 | #332 | Tragic 23.8% |
| Immigrants | Trinidad and Tobago | 0.0 /100 | #333 | Tragic 24.6% |
| Immigrants | Bangladesh | 0.0 /100 | #334 | Tragic 25.8% |
| Barbadians | 0.0 /100 | #335 | Tragic 26.1% |
| Vietnamese | 0.0 /100 | #336 | Tragic 26.2% |
| Immigrants | Uzbekistan | 0.0 /100 | #337 | Tragic 26.7% |