Immigrants from South Eastern Asia vs Canadian No Vehicles in Household
COMPARE
Immigrants from South Eastern Asia
Canadian
No Vehicles in Household
No Vehicles in Household Comparison
Immigrants from South Eastern Asia
Canadians
8.6%
NO VEHICLES IN HOUSEHOLD
99.4/ 100
METRIC RATING
82nd/ 347
METRIC RANK
8.3%
NO VEHICLES IN HOUSEHOLD
99.7/ 100
METRIC RATING
65th/ 347
METRIC RANK
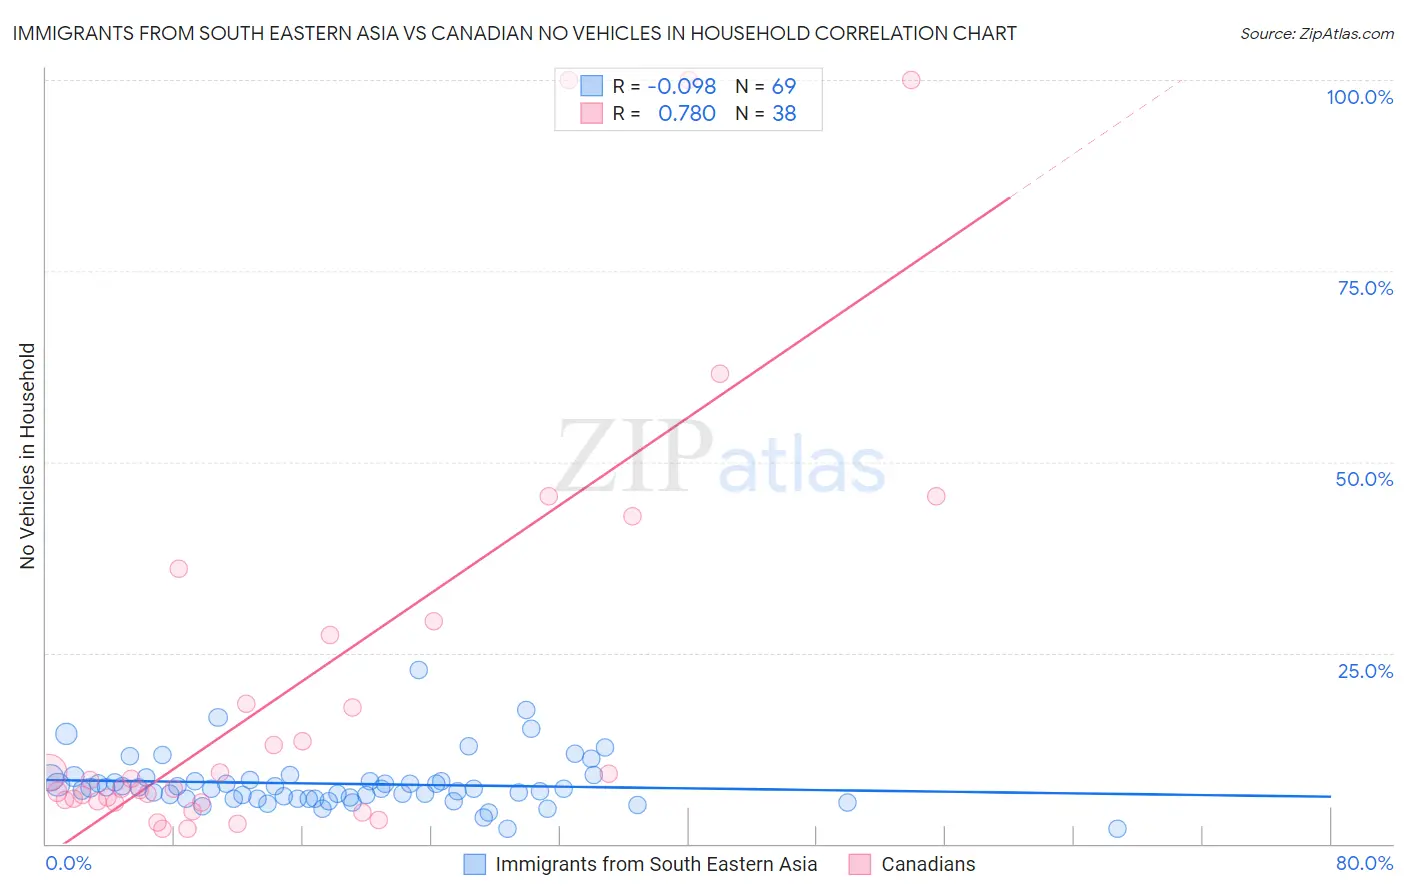
Immigrants from South Eastern Asia vs Canadian No Vehicles in Household Correlation Chart
The statistical analysis conducted on geographies consisting of 510,199,602 people shows a slight negative correlation between the proportion of Immigrants from South Eastern Asia and percentage of households with no vehicle available in the United States with a correlation coefficient (R) of -0.098 and weighted average of 8.6%. Similarly, the statistical analysis conducted on geographies consisting of 435,931,333 people shows a strong positive correlation between the proportion of Canadians and percentage of households with no vehicle available in the United States with a correlation coefficient (R) of 0.780 and weighted average of 8.3%, a difference of 3.3%.
No Vehicles in Household Correlation Summary
| Measurement | Immigrants from South Eastern Asia | Canadian |
| Minimum | 2.0% | 1.9% |
| Maximum | 22.7% | 100.0% |
| Range | 20.7% | 98.1% |
| Mean | 7.8% | 20.8% |
| Median | 7.2% | 7.8% |
| Interquartile 25% (IQ1) | 5.9% | 5.6% |
| Interquartile 75% (IQ3) | 8.3% | 27.3% |
| Interquartile Range (IQR) | 2.4% | 21.7% |
| Standard Deviation (Sample) | 3.4% | 27.6% |
| Standard Deviation (Population) | 3.4% | 27.2% |
Demographics Similar to Immigrants from South Eastern Asia and Canadians by No Vehicles in Household
In terms of no vehicles in household, the demographic groups most similar to Immigrants from South Eastern Asia are Tsimshian (8.6%, a difference of 0.13%), Bolivian (8.6%, a difference of 0.18%), Portuguese (8.6%, a difference of 0.33%), Italian (8.6%, a difference of 0.34%), and Immigrants from South Central Asia (8.6%, a difference of 0.39%). Similarly, the demographic groups most similar to Canadians are Palestinian (8.3%, a difference of 0.11%), Immigrants from Scotland (8.3%, a difference of 0.12%), Immigrants from Iran (8.4%, a difference of 0.52%), Spaniard (8.4%, a difference of 0.57%), and Croatian (8.3%, a difference of 0.75%).
| Demographics | Rating | Rank | No Vehicles in Household |
| Slovaks | 99.8 /100 | #63 | Exceptional 8.3% |
| Croatians | 99.8 /100 | #64 | Exceptional 8.3% |
| Canadians | 99.7 /100 | #65 | Exceptional 8.3% |
| Palestinians | 99.7 /100 | #66 | Exceptional 8.3% |
| Immigrants | Scotland | 99.7 /100 | #67 | Exceptional 8.3% |
| Immigrants | Iran | 99.7 /100 | #68 | Exceptional 8.4% |
| Spaniards | 99.7 /100 | #69 | Exceptional 8.4% |
| Cajuns | 99.6 /100 | #70 | Exceptional 8.4% |
| Immigrants | Lebanon | 99.6 /100 | #71 | Exceptional 8.4% |
| Lithuanians | 99.6 /100 | #72 | Exceptional 8.4% |
| Poles | 99.6 /100 | #73 | Exceptional 8.4% |
| Cubans | 99.5 /100 | #74 | Exceptional 8.5% |
| Jordanians | 99.5 /100 | #75 | Exceptional 8.5% |
| Immigrants | Philippines | 99.5 /100 | #76 | Exceptional 8.5% |
| Iranians | 99.5 /100 | #77 | Exceptional 8.6% |
| Immigrants | South Central Asia | 99.5 /100 | #78 | Exceptional 8.6% |
| Portuguese | 99.5 /100 | #79 | Exceptional 8.6% |
| Bolivians | 99.4 /100 | #80 | Exceptional 8.6% |
| Tsimshian | 99.4 /100 | #81 | Exceptional 8.6% |
| Immigrants | South Eastern Asia | 99.4 /100 | #82 | Exceptional 8.6% |
| Italians | 99.4 /100 | #83 | Exceptional 8.6% |