Immigrants from Grenada vs Sierra Leonean No Vehicles in Household
COMPARE
Immigrants from Grenada
Sierra Leonean
No Vehicles in Household
No Vehicles in Household Comparison
Immigrants from Grenada
Sierra Leoneans
37.5%
NO VEHICLES IN HOUSEHOLD
0.0/ 100
METRIC RATING
346th/ 347
METRIC RANK
11.0%
NO VEHICLES IN HOUSEHOLD
15.7/ 100
METRIC RATING
207th/ 347
METRIC RANK
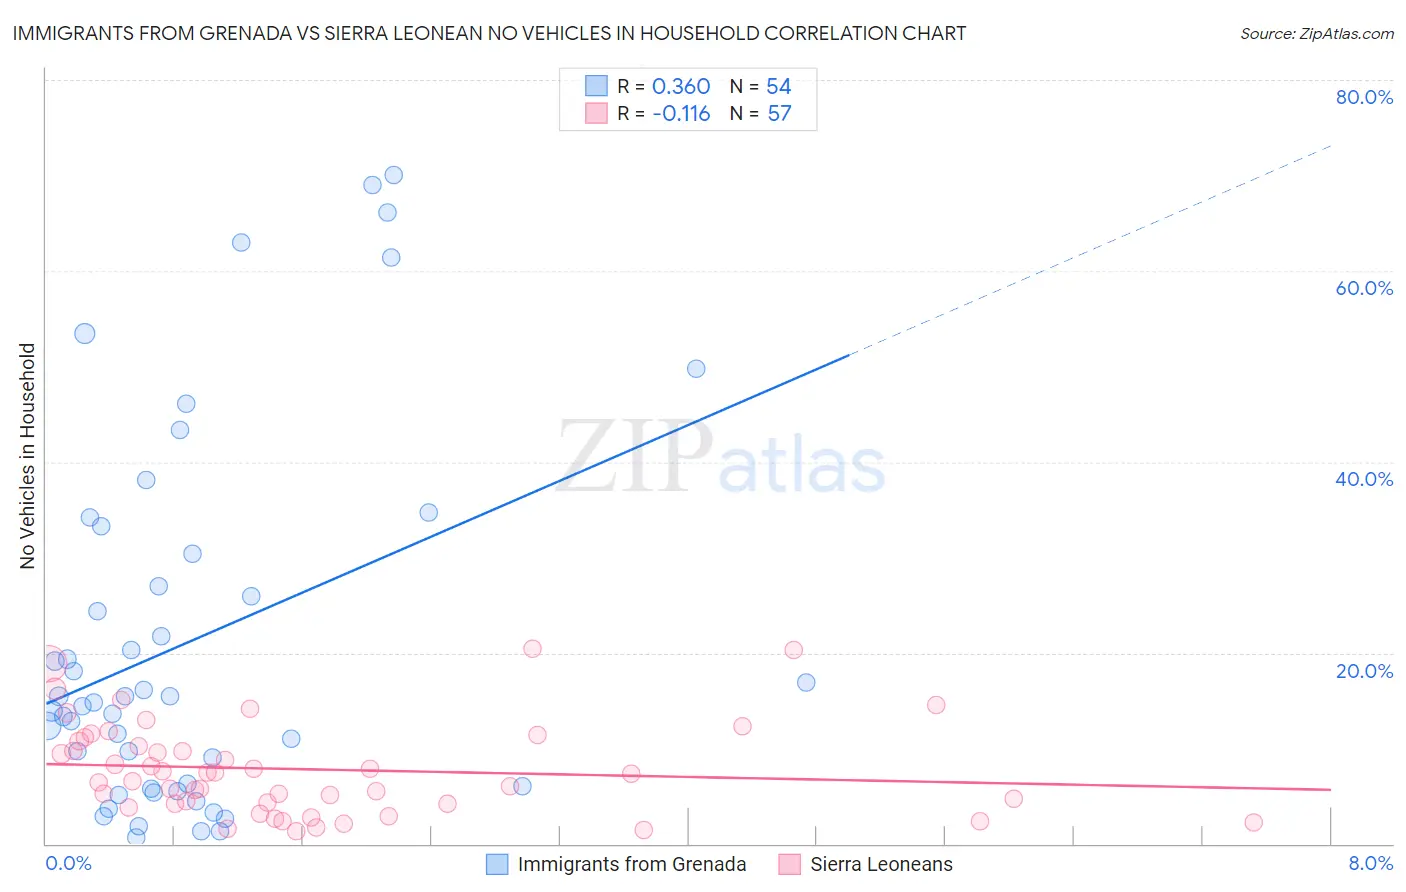
Immigrants from Grenada vs Sierra Leonean No Vehicles in Household Correlation Chart
The statistical analysis conducted on geographies consisting of 67,165,331 people shows a mild positive correlation between the proportion of Immigrants from Grenada and percentage of households with no vehicle available in the United States with a correlation coefficient (R) of 0.360 and weighted average of 37.5%. Similarly, the statistical analysis conducted on geographies consisting of 83,300,875 people shows a poor negative correlation between the proportion of Sierra Leoneans and percentage of households with no vehicle available in the United States with a correlation coefficient (R) of -0.116 and weighted average of 11.0%, a difference of 240.7%.
No Vehicles in Household Correlation Summary
| Measurement | Immigrants from Grenada | Sierra Leonean |
| Minimum | 0.72% | 1.4% |
| Maximum | 70.0% | 20.4% |
| Range | 69.3% | 19.0% |
| Mean | 21.3% | 7.8% |
| Median | 15.1% | 7.3% |
| Interquartile 25% (IQ1) | 6.0% | 4.2% |
| Interquartile 75% (IQ3) | 30.4% | 11.0% |
| Interquartile Range (IQR) | 24.4% | 6.8% |
| Standard Deviation (Sample) | 19.3% | 4.8% |
| Standard Deviation (Population) | 19.1% | 4.8% |
Similar Demographics by No Vehicles in Household
Demographics Similar to Immigrants from Grenada by No Vehicles in Household
In terms of no vehicles in household, the demographic groups most similar to Immigrants from Grenada are Immigrants from St. Vincent and the Grenadines (35.4%, a difference of 5.8%), Immigrants from Dominican Republic (31.4%, a difference of 19.2%), Yup'ik (45.9%, a difference of 22.5%), Inupiat (29.9%, a difference of 25.5%), and British West Indian (29.7%, a difference of 26.0%).
| Demographics | Rating | Rank | No Vehicles in Household |
| Immigrants | Trinidad and Tobago | 0.0 /100 | #333 | Tragic 24.6% |
| Immigrants | Bangladesh | 0.0 /100 | #334 | Tragic 25.8% |
| Barbadians | 0.0 /100 | #335 | Tragic 26.1% |
| Vietnamese | 0.0 /100 | #336 | Tragic 26.2% |
| Immigrants | Uzbekistan | 0.0 /100 | #337 | Tragic 26.7% |
| Guyanese | 0.0 /100 | #338 | Tragic 29.3% |
| Dominicans | 0.0 /100 | #339 | Tragic 29.4% |
| Immigrants | Barbados | 0.0 /100 | #340 | Tragic 29.5% |
| Immigrants | Guyana | 0.0 /100 | #341 | Tragic 29.5% |
| British West Indians | 0.0 /100 | #342 | Tragic 29.7% |
| Inupiat | 0.0 /100 | #343 | Tragic 29.9% |
| Immigrants | Dominican Republic | 0.0 /100 | #344 | Tragic 31.4% |
| Immigrants | St. Vincent and the Grenadines | 0.0 /100 | #345 | Tragic 35.4% |
| Immigrants | Grenada | 0.0 /100 | #346 | Tragic 37.5% |
| Yup'ik | 0.0 /100 | #347 | Tragic 45.9% |
Demographics Similar to Sierra Leoneans by No Vehicles in Household
In terms of no vehicles in household, the demographic groups most similar to Sierra Leoneans are Immigrants from Italy (11.0%, a difference of 0.010%), Immigrants from Chile (11.0%, a difference of 0.050%), Somali (11.0%, a difference of 0.050%), Pennsylvania German (11.0%, a difference of 0.050%), and Guatemalan (11.0%, a difference of 0.10%).
| Demographics | Rating | Rank | No Vehicles in Household |
| Cambodians | 19.6 /100 | #200 | Poor 10.9% |
| Immigrants | Western Europe | 19.1 /100 | #201 | Poor 10.9% |
| Romanians | 17.9 /100 | #202 | Poor 10.9% |
| Iroquois | 17.6 /100 | #203 | Poor 10.9% |
| Guatemalans | 16.1 /100 | #204 | Poor 11.0% |
| Immigrants | Chile | 15.9 /100 | #205 | Poor 11.0% |
| Somalis | 15.9 /100 | #206 | Poor 11.0% |
| Sierra Leoneans | 15.7 /100 | #207 | Poor 11.0% |
| Immigrants | Italy | 15.6 /100 | #208 | Poor 11.0% |
| Pennsylvania Germans | 15.5 /100 | #209 | Poor 11.0% |
| Apache | 14.8 /100 | #210 | Poor 11.0% |
| Crow | 14.2 /100 | #211 | Poor 11.0% |
| Immigrants | Western Asia | 13.9 /100 | #212 | Poor 11.0% |
| Immigrants | Hungary | 12.3 /100 | #213 | Poor 11.1% |
| Immigrants | Denmark | 12.1 /100 | #214 | Poor 11.1% |