Immigrants from Grenada vs Sierra Leonean Seniors Poverty Over the Age of 75
COMPARE
Immigrants from Grenada
Sierra Leonean
Seniors Poverty Over the Age of 75
Seniors Poverty Over the Age of 75 Comparison
Immigrants from Grenada
Sierra Leoneans
17.8%
SENIORS POVERTY OVER THE AGE OF 75
0.0/ 100
METRIC RATING
334th/ 347
METRIC RANK
11.4%
SENIORS POVERTY OVER THE AGE OF 75
96.1/ 100
METRIC RATING
72nd/ 347
METRIC RANK
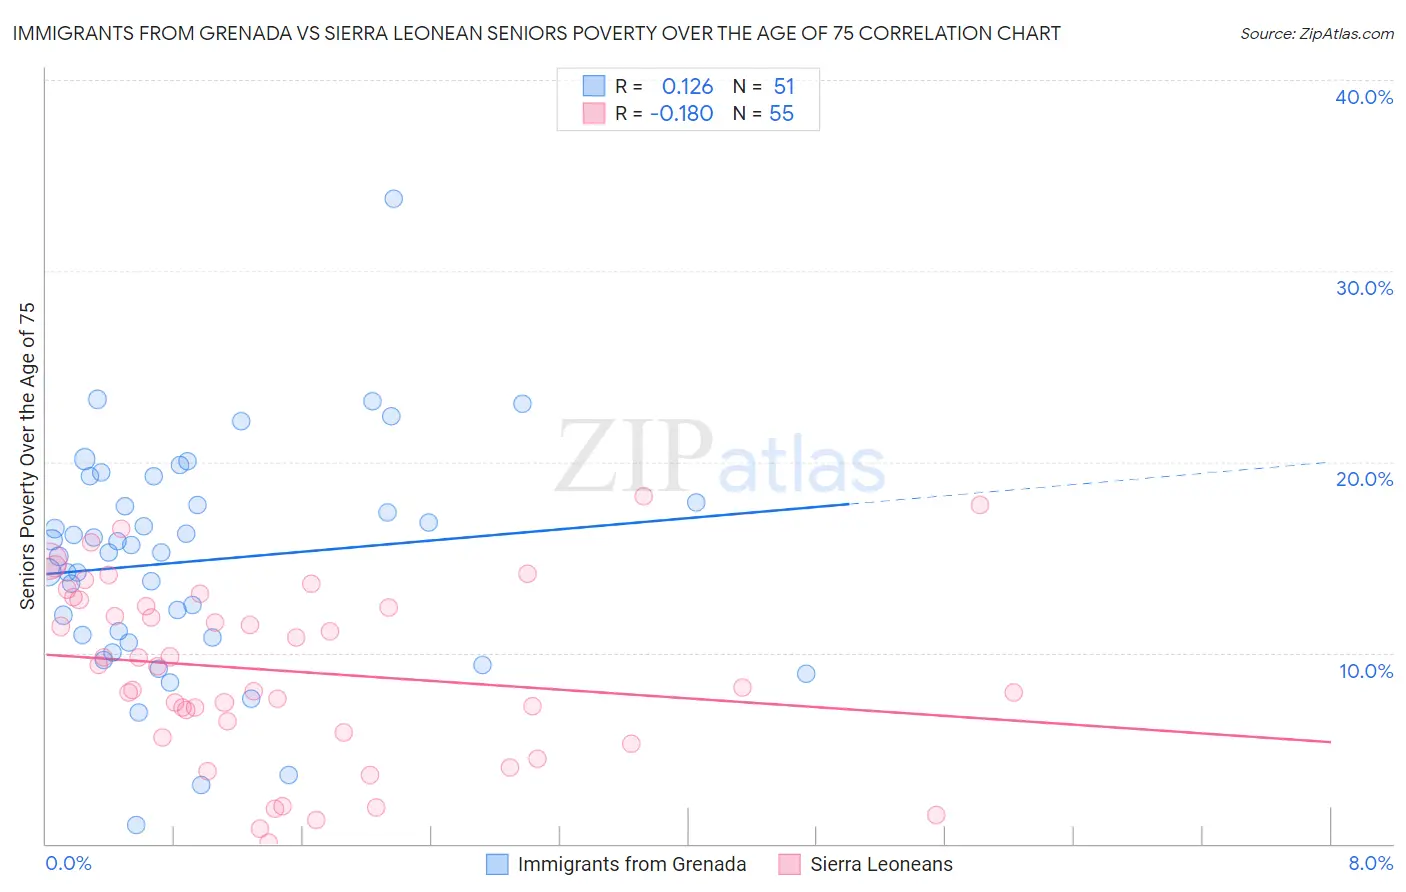
Immigrants from Grenada vs Sierra Leonean Seniors Poverty Over the Age of 75 Correlation Chart
The statistical analysis conducted on geographies consisting of 66,944,348 people shows a poor positive correlation between the proportion of Immigrants from Grenada and poverty level among seniors over the age of 75 in the United States with a correlation coefficient (R) of 0.126 and weighted average of 17.8%. Similarly, the statistical analysis conducted on geographies consisting of 83,077,533 people shows a poor negative correlation between the proportion of Sierra Leoneans and poverty level among seniors over the age of 75 in the United States with a correlation coefficient (R) of -0.180 and weighted average of 11.4%, a difference of 56.6%.
Seniors Poverty Over the Age of 75 Correlation Summary
| Measurement | Immigrants from Grenada | Sierra Leonean |
| Minimum | 0.99% | 0.097% |
| Maximum | 33.8% | 18.2% |
| Range | 32.8% | 18.1% |
| Mean | 14.8% | 9.0% |
| Median | 15.3% | 9.3% |
| Interquartile 25% (IQ1) | 10.8% | 5.8% |
| Interquartile 75% (IQ3) | 17.8% | 12.8% |
| Interquartile Range (IQR) | 7.0% | 6.9% |
| Standard Deviation (Sample) | 5.9% | 4.6% |
| Standard Deviation (Population) | 5.8% | 4.6% |
Similar Demographics by Seniors Poverty Over the Age of 75
Demographics Similar to Immigrants from Grenada by Seniors Poverty Over the Age of 75
In terms of seniors poverty over the age of 75, the demographic groups most similar to Immigrants from Grenada are Cuban (18.0%, a difference of 0.59%), Immigrants from Nicaragua (17.6%, a difference of 1.5%), Immigrants from St. Vincent and the Grenadines (17.5%, a difference of 2.0%), Immigrants from Armenia (17.5%, a difference of 2.2%), and Immigrants from Caribbean (18.2%, a difference of 2.2%).
| Demographics | Rating | Rank | Seniors Poverty Over the Age of 75 |
| Sioux | 0.0 /100 | #327 | Tragic 16.8% |
| Cape Verdeans | 0.0 /100 | #328 | Tragic 16.8% |
| Immigrants | Dominica | 0.0 /100 | #329 | Tragic 17.0% |
| British West Indians | 0.0 /100 | #330 | Tragic 17.4% |
| Immigrants | Armenia | 0.0 /100 | #331 | Tragic 17.5% |
| Immigrants | St. Vincent and the Grenadines | 0.0 /100 | #332 | Tragic 17.5% |
| Immigrants | Nicaragua | 0.0 /100 | #333 | Tragic 17.6% |
| Immigrants | Grenada | 0.0 /100 | #334 | Tragic 17.8% |
| Cubans | 0.0 /100 | #335 | Tragic 18.0% |
| Immigrants | Caribbean | 0.0 /100 | #336 | Tragic 18.2% |
| Yakama | 0.0 /100 | #337 | Tragic 18.3% |
| Immigrants | Cabo Verde | 0.0 /100 | #338 | Tragic 18.5% |
| Hopi | 0.0 /100 | #339 | Tragic 18.9% |
| Tohono O'odham | 0.0 /100 | #340 | Tragic 19.1% |
| Navajo | 0.0 /100 | #341 | Tragic 19.4% |
Demographics Similar to Sierra Leoneans by Seniors Poverty Over the Age of 75
In terms of seniors poverty over the age of 75, the demographic groups most similar to Sierra Leoneans are Immigrants from Micronesia (11.4%, a difference of 0.090%), Osage (11.4%, a difference of 0.10%), Delaware (11.4%, a difference of 0.10%), Immigrants from South Central Asia (11.4%, a difference of 0.18%), and Palestinian (11.4%, a difference of 0.19%).
| Demographics | Rating | Rank | Seniors Poverty Over the Age of 75 |
| Immigrants | Taiwan | 96.7 /100 | #65 | Exceptional 11.4% |
| Estonians | 96.7 /100 | #66 | Exceptional 11.4% |
| Bolivians | 96.5 /100 | #67 | Exceptional 11.4% |
| Immigrants | Austria | 96.5 /100 | #68 | Exceptional 11.4% |
| Ottawa | 96.5 /100 | #69 | Exceptional 11.4% |
| Immigrants | South Central Asia | 96.4 /100 | #70 | Exceptional 11.4% |
| Osage | 96.3 /100 | #71 | Exceptional 11.4% |
| Sierra Leoneans | 96.1 /100 | #72 | Exceptional 11.4% |
| Immigrants | Micronesia | 96.0 /100 | #73 | Exceptional 11.4% |
| Delaware | 96.0 /100 | #74 | Exceptional 11.4% |
| Palestinians | 95.8 /100 | #75 | Exceptional 11.4% |
| French Canadians | 95.7 /100 | #76 | Exceptional 11.4% |
| Whites/Caucasians | 95.5 /100 | #77 | Exceptional 11.4% |
| Macedonians | 95.5 /100 | #78 | Exceptional 11.4% |
| Filipinos | 95.5 /100 | #79 | Exceptional 11.4% |