Immigrants from France vs Bulgarian No Vehicles in Household
COMPARE
Immigrants from France
Bulgarian
No Vehicles in Household
No Vehicles in Household Comparison
Immigrants from France
Bulgarians
12.9%
NO VEHICLES IN HOUSEHOLD
0.1/ 100
METRIC RATING
273rd/ 347
METRIC RANK
9.0%
NO VEHICLES IN HOUSEHOLD
98.4/ 100
METRIC RATING
99th/ 347
METRIC RANK
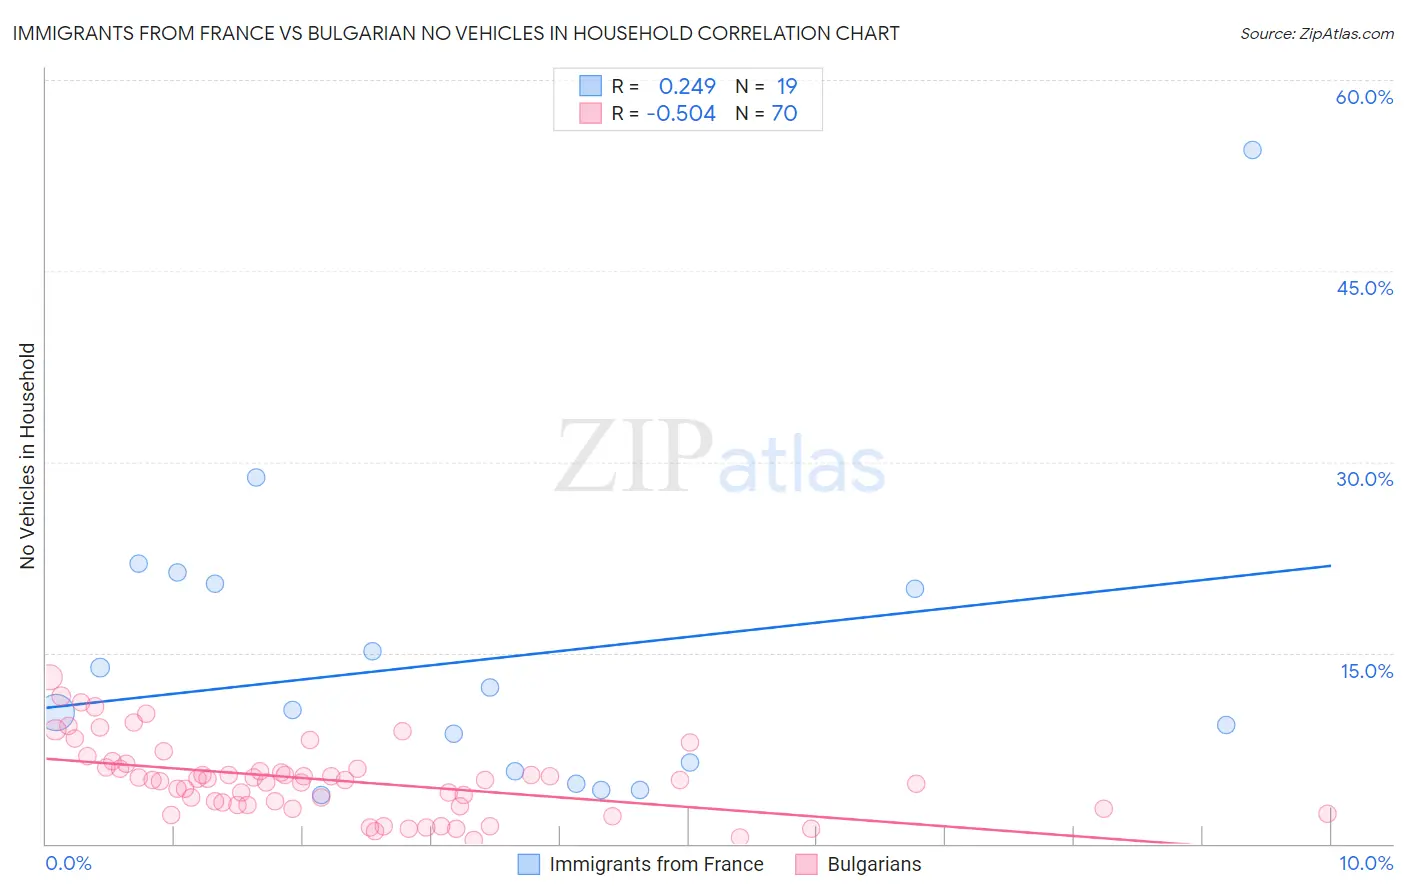
Immigrants from France vs Bulgarian No Vehicles in Household Correlation Chart
The statistical analysis conducted on geographies consisting of 287,518,995 people shows a weak positive correlation between the proportion of Immigrants from France and percentage of households with no vehicle available in the United States with a correlation coefficient (R) of 0.249 and weighted average of 12.9%. Similarly, the statistical analysis conducted on geographies consisting of 205,400,683 people shows a substantial negative correlation between the proportion of Bulgarians and percentage of households with no vehicle available in the United States with a correlation coefficient (R) of -0.504 and weighted average of 9.0%, a difference of 44.5%.
No Vehicles in Household Correlation Summary
| Measurement | Immigrants from France | Bulgarian |
| Minimum | 3.9% | 0.29% |
| Maximum | 54.5% | 13.1% |
| Range | 50.6% | 12.8% |
| Mean | 14.5% | 5.0% |
| Median | 10.5% | 5.0% |
| Interquartile 25% (IQ1) | 5.7% | 3.1% |
| Interquartile 75% (IQ3) | 20.4% | 6.0% |
| Interquartile Range (IQR) | 14.7% | 2.9% |
| Standard Deviation (Sample) | 12.1% | 2.9% |
| Standard Deviation (Population) | 11.8% | 2.8% |
Similar Demographics by No Vehicles in Household
Demographics Similar to Immigrants from France by No Vehicles in Household
In terms of no vehicles in household, the demographic groups most similar to Immigrants from France are Immigrants from Singapore (12.9%, a difference of 0.040%), Immigrants from Albania (13.0%, a difference of 0.22%), Immigrants from Southern Europe (13.0%, a difference of 0.58%), Aleut (13.0%, a difference of 0.66%), and Immigrants from Croatia (13.0%, a difference of 0.70%).
| Demographics | Rating | Rank | No Vehicles in Household |
| Israelis | 0.3 /100 | #266 | Tragic 12.4% |
| Immigrants | Europe | 0.3 /100 | #267 | Tragic 12.5% |
| Immigrants | Africa | 0.2 /100 | #268 | Tragic 12.5% |
| Panamanians | 0.2 /100 | #269 | Tragic 12.5% |
| Immigrants | Northern Africa | 0.2 /100 | #270 | Tragic 12.6% |
| Immigrants | Morocco | 0.2 /100 | #271 | Tragic 12.6% |
| Bermudans | 0.1 /100 | #272 | Tragic 12.8% |
| Immigrants | France | 0.1 /100 | #273 | Tragic 12.9% |
| Immigrants | Singapore | 0.1 /100 | #274 | Tragic 12.9% |
| Immigrants | Albania | 0.1 /100 | #275 | Tragic 13.0% |
| Immigrants | Southern Europe | 0.1 /100 | #276 | Tragic 13.0% |
| Aleuts | 0.1 /100 | #277 | Tragic 13.0% |
| Immigrants | Croatia | 0.1 /100 | #278 | Tragic 13.0% |
| Mongolians | 0.0 /100 | #279 | Tragic 13.1% |
| Alsatians | 0.0 /100 | #280 | Tragic 13.2% |
Demographics Similar to Bulgarians by No Vehicles in Household
In terms of no vehicles in household, the demographic groups most similar to Bulgarians are Slavic (9.0%, a difference of 0.060%), Asian (9.0%, a difference of 0.18%), Pakistani (9.0%, a difference of 0.22%), Yugoslavian (9.0%, a difference of 0.27%), and Seminole (9.0%, a difference of 0.27%).
| Demographics | Rating | Rank | No Vehicles in Household |
| Immigrants | Canada | 99.1 /100 | #92 | Exceptional 8.7% |
| Immigrants | North America | 99.1 /100 | #93 | Exceptional 8.7% |
| Austrians | 98.9 /100 | #94 | Exceptional 8.8% |
| Potawatomi | 98.8 /100 | #95 | Exceptional 8.8% |
| Immigrants | Bolivia | 98.7 /100 | #96 | Exceptional 8.9% |
| Immigrants | Central America | 98.5 /100 | #97 | Exceptional 8.9% |
| Slavs | 98.4 /100 | #98 | Exceptional 9.0% |
| Bulgarians | 98.4 /100 | #99 | Exceptional 9.0% |
| Asians | 98.3 /100 | #100 | Exceptional 9.0% |
| Pakistanis | 98.3 /100 | #101 | Exceptional 9.0% |
| Yugoslavians | 98.3 /100 | #102 | Exceptional 9.0% |
| Seminole | 98.3 /100 | #103 | Exceptional 9.0% |
| Zimbabweans | 98.0 /100 | #104 | Exceptional 9.0% |
| Spanish Americans | 97.9 /100 | #105 | Exceptional 9.1% |
| Laotians | 97.8 /100 | #106 | Exceptional 9.1% |