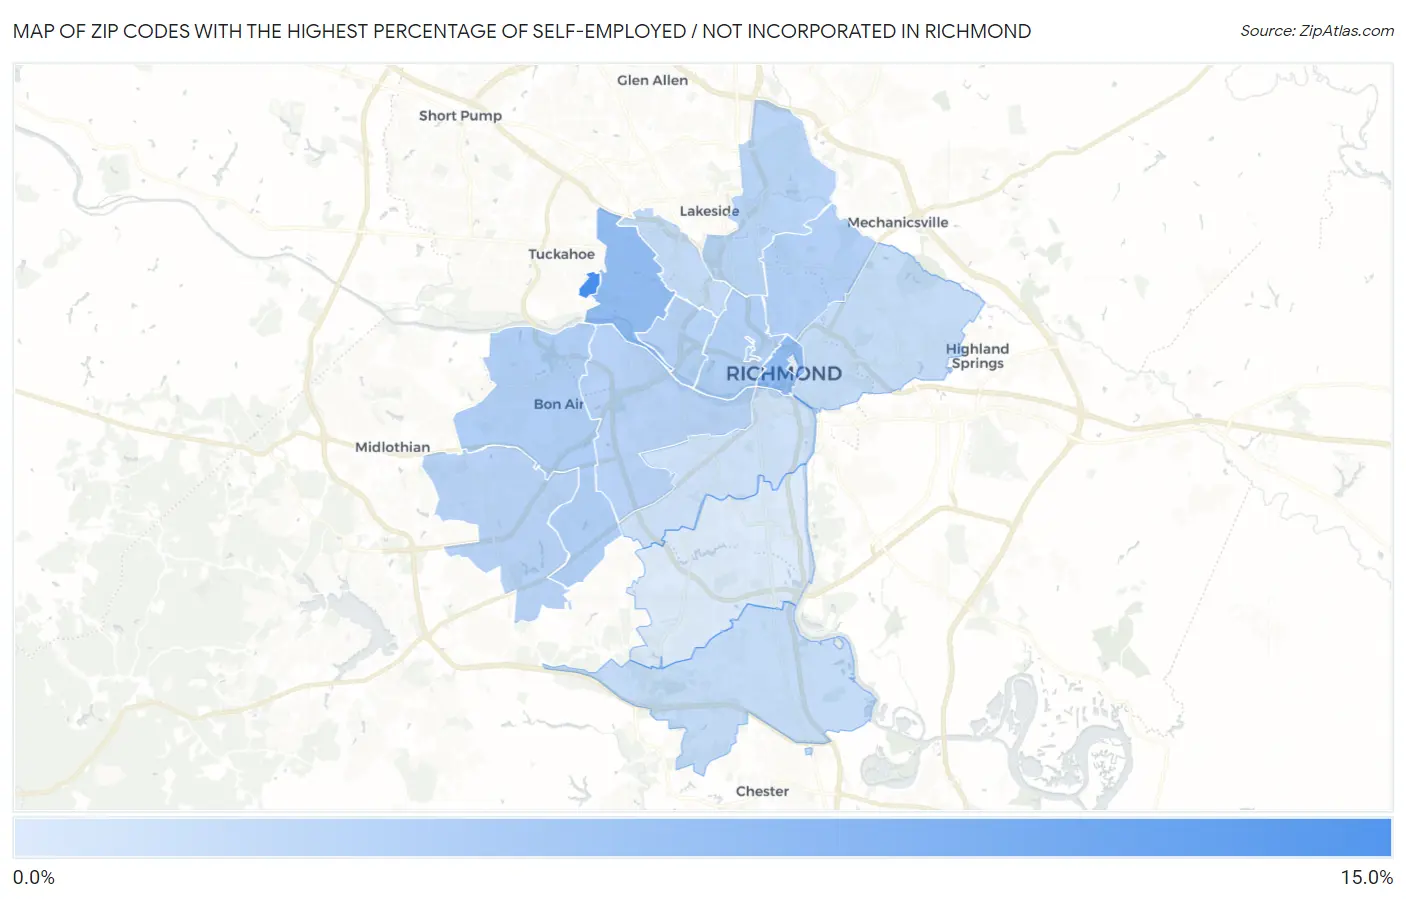
Zip Codes with the Highest Percentage of Self-Employed / Not Incorporated in Richmond, VA
RELATED REPORTS & OPTIONS
Self-Employed / Not Incorporated
Richmond
Compare Zip Codes
Map of Zip Codes with the Highest Percentage of Self-Employed / Not Incorporated in Richmond
0.0%
15.0%
Zip Codes with the Highest Percentage of Self-Employed / Not Incorporated in Richmond, VA
| Zip Code | % Self-Employed / Not Incorporated | vs State | vs National | |
| 1. | 23173 | 12.0% | 4.7%(+7.28)#99 | 5.8%(+6.16)#5,310 |
| 2. | 23219 | 7.0% | 4.7%(+2.27)#245 | 5.8%(+1.15)#13,149 |
| 3. | 23226 | 6.8% | 4.7%(+2.10)#254 | 5.8%(+0.971)#13,620 |
| 4. | 23284 | 4.8% | 4.7%(+0.154)#412 | 5.8%(-0.971)#20,245 |
| 5. | 23235 | 4.8% | 4.7%(+0.093)#421 | 5.8%(-1.03)#20,479 |
| 6. | 23222 | 4.7% | 4.7%(-0.008)#431 | 5.8%(-1.13)#20,858 |
| 7. | 23220 | 4.6% | 4.7%(-0.073)#439 | 5.8%(-1.20)#21,097 |
| 8. | 23221 | 4.4% | 4.7%(-0.282)#468 | 5.8%(-1.41)#21,925 |
| 9. | 23236 | 4.4% | 4.7%(-0.304)#470 | 5.8%(-1.43)#22,001 |
| 10. | 23225 | 4.3% | 4.7%(-0.418)#485 | 5.8%(-1.54)#22,426 |
| 11. | 23227 | 4.2% | 4.7%(-0.527)#505 | 5.8%(-1.65)#22,829 |
| 12. | 23230 | 3.6% | 4.7%(-1.13)#569 | 5.8%(-2.25)#24,816 |
| 13. | 23223 | 3.4% | 4.7%(-1.34)#588 | 5.8%(-2.46)#25,445 |
| 14. | 23237 | 3.4% | 4.7%(-1.34)#589 | 5.8%(-2.46)#25,446 |
| 15. | 23224 | 2.8% | 4.7%(-1.88)#640 | 5.8%(-3.01)#26,818 |
| 16. | 23234 | 1.9% | 4.7%(-2.76)#700 | 5.8%(-3.88)#28,330 |
1
Common Questions
What are the Top 10 Zip Codes with the Highest Percentage of Self-Employed / Not Incorporated in Richmond, VA?
Top 10 Zip Codes with the Highest Percentage of Self-Employed / Not Incorporated in Richmond, VA are:
What zip code has the Highest Percentage of Self-Employed / Not Incorporated in Richmond, VA?
23173 has the Highest Percentage of Self-Employed / Not Incorporated in Richmond, VA with 12.0%.
What is the Percentage of Self-Employed / Not Incorporated in Richmond, VA?
Percentage of Self-Employed / Not Incorporated in Richmond is 4.4%.
What is the Percentage of Self-Employed / Not Incorporated in Virginia?
Percentage of Self-Employed / Not Incorporated in Virginia is 4.7%.
What is the Percentage of Self-Employed / Not Incorporated in the United States?
Percentage of Self-Employed / Not Incorporated in the United States is 5.8%.