Zip Codes with the Most Immigrants from South Eastern Asia in Delaware
RELATED REPORTS & OPTIONS
South Eastern Asia
Delaware
Compare Zip Codes
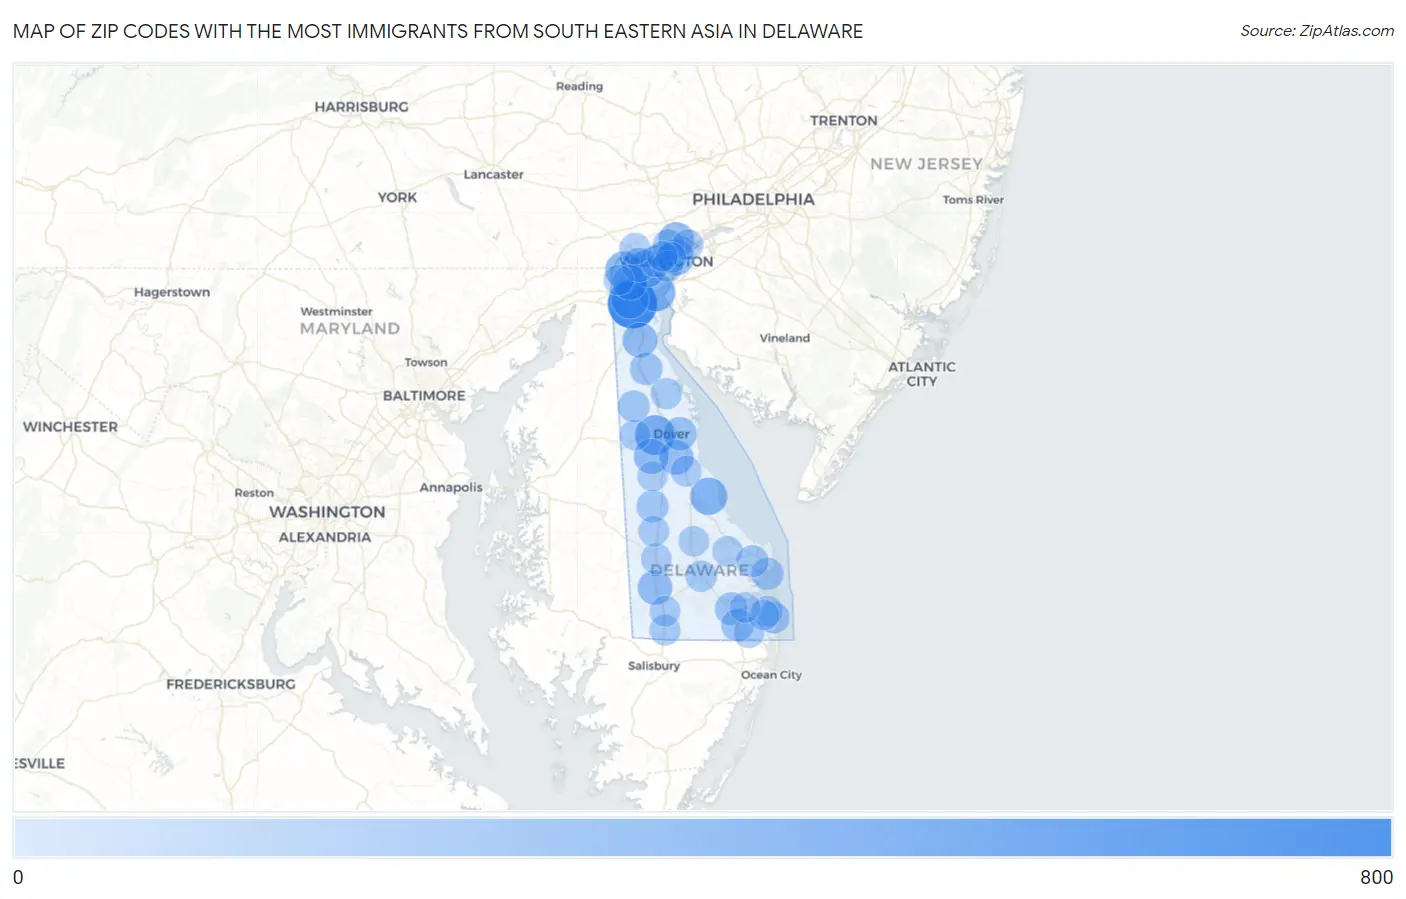
Map of Zip Codes with the Most Immigrants from South Eastern Asia in Delaware
0
800
Zip Codes with the Most Immigrants from South Eastern Asia in Delaware
| Zip Code | South Eastern Asia | vs State | vs National | |
| 1. | 19701 | 757 | 5,112(14.81%)#1 | 4,292,058(0.02%)#1,304 |
| 2. | 19904 | 366 | 5,112(7.16%)#2 | 4,292,058(0.01%)#2,528 |
| 3. | 19720 | 294 | 5,112(5.75%)#3 | 4,292,058(0.01%)#2,997 |
| 4. | 19963 | 266 | 5,112(5.20%)#4 | 4,292,058(0.01%)#3,242 |
| 5. | 19711 | 264 | 5,112(5.16%)#5 | 4,292,058(0.01%)#3,258 |
| 6. | 19702 | 262 | 5,112(5.13%)#6 | 4,292,058(0.01%)#3,278 |
| 7. | 19804 | 257 | 5,112(5.03%)#7 | 4,292,058(0.01%)#3,331 |
| 8. | 19809 | 212 | 5,112(4.15%)#8 | 4,292,058(0.00%)#3,861 |
| 9. | 19810 | 208 | 5,112(4.07%)#9 | 4,292,058(0.00%)#3,911 |
| 10. | 19934 | 180 | 5,112(3.52%)#10 | 4,292,058(0.00%)#4,311 |
| 11. | 19709 | 178 | 5,112(3.48%)#11 | 4,292,058(0.00%)#4,337 |
| 12. | 19713 | 176 | 5,112(3.44%)#12 | 4,292,058(0.00%)#4,381 |
| 13. | 19962 | 166 | 5,112(3.25%)#13 | 4,292,058(0.00%)#4,549 |
| 14. | 19973 | 165 | 5,112(3.23%)#14 | 4,292,058(0.00%)#4,561 |
| 15. | 19808 | 140 | 5,112(2.74%)#15 | 4,292,058(0.00%)#4,998 |
| 16. | 19901 | 124 | 5,112(2.43%)#16 | 4,292,058(0.00%)#5,333 |
| 17. | 19966 | 93 | 5,112(1.82%)#17 | 4,292,058(0.00%)#6,101 |
| 18. | 19734 | 91 | 5,112(1.78%)#18 | 4,292,058(0.00%)#6,177 |
| 19. | 19945 | 90 | 5,112(1.76%)#19 | 4,292,058(0.00%)#6,219 |
| 20. | 19971 | 77 | 5,112(1.51%)#20 | 4,292,058(0.00%)#6,624 |
| 21. | 19952 | 76 | 5,112(1.49%)#21 | 4,292,058(0.00%)#6,659 |
| 22. | 19958 | 70 | 5,112(1.37%)#22 | 4,292,058(0.00%)#6,873 |
| 23. | 19805 | 61 | 5,112(1.19%)#23 | 4,292,058(0.00%)#7,230 |
| 24. | 19803 | 59 | 5,112(1.15%)#24 | 4,292,058(0.00%)#7,324 |
| 25. | 19938 | 59 | 5,112(1.15%)#25 | 4,292,058(0.00%)#7,346 |
| 26. | 19930 | 54 | 5,112(1.06%)#26 | 4,292,058(0.00%)#7,597 |
| 27. | 19707 | 50 | 5,112(0.98%)#27 | 4,292,058(0.00%)#7,782 |
| 28. | 19947 | 33 | 5,112(0.65%)#28 | 4,292,058(0.00%)#8,907 |
| 29. | 19977 | 31 | 5,112(0.61%)#29 | 4,292,058(0.00%)#9,084 |
| 30. | 19970 | 29 | 5,112(0.57%)#30 | 4,292,058(0.00%)#9,323 |
| 31. | 19703 | 28 | 5,112(0.55%)#31 | 4,292,058(0.00%)#9,386 |
| 32. | 19801 | 27 | 5,112(0.53%)#32 | 4,292,058(0.00%)#9,481 |
| 33. | 19940 | 23 | 5,112(0.45%)#33 | 4,292,058(0.00%)#9,933 |
| 34. | 19946 | 21 | 5,112(0.41%)#34 | 4,292,058(0.00%)#10,193 |
| 35. | 19933 | 18 | 5,112(0.35%)#35 | 4,292,058(0.00%)#10,526 |
| 36. | 19975 | 17 | 5,112(0.33%)#36 | 4,292,058(0.00%)#10,660 |
| 37. | 19967 | 17 | 5,112(0.33%)#37 | 4,292,058(0.00%)#10,745 |
| 38. | 19950 | 16 | 5,112(0.31%)#38 | 4,292,058(0.00%)#10,842 |
| 39. | 19956 | 14 | 5,112(0.27%)#39 | 4,292,058(0.00%)#11,104 |
| 40. | 19953 | 12 | 5,112(0.23%)#40 | 4,292,058(0.00%)#11,497 |
| 41. | 19939 | 10 | 5,112(0.20%)#41 | 4,292,058(0.00%)#11,895 |
| 42. | 19802 | 8 | 5,112(0.16%)#42 | 4,292,058(0.00%)#12,317 |
| 43. | 19968 | 4 | 5,112(0.08%)#43 | 4,292,058(0.00%)#13,502 |
| 44. | 19943 | 3 | 5,112(0.06%)#44 | 4,292,058(0.00%)#13,865 |
| 45. | 19806 | 2 | 5,112(0.04%)#45 | 4,292,058(0.00%)#14,276 |
| 46. | 19717 | 2 | 5,112(0.04%)#46 | 4,292,058(0.00%)#14,307 |
| 47. | 19941 | 2 | 5,112(0.04%)#47 | 4,292,058(0.00%)#14,372 |
1
Common Questions
What are the Top 10 Zip Codes with the Most Immigrants from South Eastern Asia in Delaware?
Top 10 Zip Codes with the Most Immigrants from South Eastern Asia in Delaware are:
What zip code has the Most Immigrants from South Eastern Asia in Delaware?
19701 has the Most Immigrants from South Eastern Asia in Delaware with 757.
What is the Total Immigrants from South Eastern Asia in the State of Delaware?
Total Immigrants from South Eastern Asia in Delaware is 5,112.
What is the Total Immigrants from South Eastern Asia in the United States?
Total Immigrants from South Eastern Asia in the United States is 4,292,058.