Zimbabwean vs Immigrants from South America Unemployment Among Ages 45 to 54 years

COMPARE

Zimbabwean
Race
Ancestry
AfghanAfricanAlaska NativeAlaskan AthabascanAlbanianAleutAlsatianAmericanApacheArabArapahoArgentineanArmenianAssyrian/Chaldean/SyriacAustralianAustrianBahamianBangladeshiBarbadianBasqueBelgianBelizeanBermudanBhutaneseBlackfeetBolivianBrazilianBritishBritish West IndianBulgarianBurmeseCajunCambodianCanadianCape VerdeanCarpatho RusynCelticCentral AmericanCentral American IndianCherokeeCheyenneChickasawChileanChineseChippewaChoctawColombianColvilleComancheCosta RicanCreeCreekCroatianCrowCubanCypriotCzechCzechoslovakianDanishDelawareDominicanDutchDutch West IndianEastern EuropeanEcuadorianEgyptianEnglishEstonianEthiopianEuropeanFijianFilipinoFinnishFrenchFrench American IndianFrench CanadianGermanGerman RussianGhanaianGreekGuamanian/ChamorroGuatemalanGuyaneseHaitianHmongHonduranHopiHoumaHungarianIcelanderIndian (Asian)IndonesianInupiatIranianIraqiIrishIroquoisIsraeliItalianJamaicanJapaneseJordanianKenyanKiowaKoreanLaotianLatvianLebaneseLiberianLithuanianLumbeeLuxembourgerMacedonianMalaysianMalteseMarshalleseMenomineeMexicanMexican American IndianMongolianMoroccanNative HawaiianNavajoNepaleseNew ZealanderNicaraguanNigerianNorthern EuropeanNorwegianOkinawanOsageOttawaPaiutePakistaniPalestinianPanamanianParaguayanPennsylvania GermanPeruvianPimaPolishPortuguesePotawatomiPuebloPuerto RicanPuget Sound SalishRomanianRussianSalvadoranSamoanScandinavianScotch-IrishScottishSeminoleSenegaleseSerbianShoshoneSierra LeoneanSiouxSlavicSlovakSloveneSomaliSouth AfricanSouth AmericanSouth American IndianSoviet UnionSpaniardSpanishSpanish AmericanSpanish American IndianSri LankanSubsaharan AfricanSudaneseSwedishSwissSyrianTaiwaneseThaiTlingit-HaidaTohono O'OdhamTonganTrinidadian and TobagonianTsimshianTurkishU.S. Virgin IslanderUgandanUkrainianUruguayanUteVenezuelanVietnameseWelshWest IndianYakamaYaquiYugoslavianYumanYup'ikZimbabwean
Immigration
NonimmigrantsImmigrantsAfghanistanAfricaAlbaniaArgentinaArmeniaAsiaAustraliaAustriaBahamasBangladeshBarbadosBelarusBelgiumBelizeBoliviaBosnia and HerzegovinaBrazilBulgariaBurma/MyanmarCabo VerdeCambodiaCameroonCanadaCaribbeanCentral AmericaChileChinaColombiaCongoCosta RicaCroatiaCubaCzechoslovakiaDenmarkDominicaDominican RepublicEastern AfricaEastern AsiaEastern EuropeEcuadorEgyptEl SalvadorEnglandEritreaEthiopiaEuropeFijiFranceGermanyGhanaGreeceGrenadaGuatemalaGuyanaHaitiHondurasHong KongHungaryIndiaIndonesiaIranIraqIrelandIsraelItalyJamaicaJapanJordanKazakhstanKenyaKoreaKuwaitLaosLatin AmericaLatviaLebanonLiberiaLithuaniaMalaysiaMexicoMicronesiaMiddle AfricaMoldovaMoroccoNepalNetherlandsNicaraguaNigeriaNorth AmericaNorth MacedoniaNorthern AfricaNorthern EuropeNorwayOceaniaPakistanPanamaPeruPhilippinesPolandPortugalRomaniaRussiaSaudi ArabiaScotlandSenegalSerbiaSierra LeoneSingaporeSomaliaSouth AfricaSouth Central AsiaSouth Eastern AsiaSouthern EuropeSpainSri LankaSt. Vincent and the GrenadinesSudanSwedenSwitzerlandSyriaTaiwanThailandTrinidad and TobagoTurkeyUgandaUkraineUruguayUzbekistanVenezuelaVietnamWest IndiesWestern AfricaWestern AsiaWestern EuropeYemenZaireZimbabweAzores
Immigrants from South America
Race
Ancestry
AfghanAfricanAlaska NativeAlaskan AthabascanAlbanianAleutAlsatianAmericanApacheArabArapahoArgentineanArmenianAssyrian/Chaldean/SyriacAustralianAustrianBahamianBangladeshiBarbadianBasqueBelgianBelizeanBermudanBhutaneseBlackfeetBolivianBrazilianBritishBritish West IndianBulgarianBurmeseCajunCambodianCanadianCape VerdeanCarpatho RusynCelticCentral AmericanCentral American IndianCherokeeCheyenneChickasawChileanChineseChippewaChoctawColombianColvilleComancheCosta RicanCreeCreekCroatianCrowCubanCypriotCzechCzechoslovakianDanishDelawareDominicanDutchDutch West IndianEastern EuropeanEcuadorianEgyptianEnglishEstonianEthiopianEuropeanFijianFilipinoFinnishFrenchFrench American IndianFrench CanadianGermanGerman RussianGhanaianGreekGuamanian/ChamorroGuatemalanGuyaneseHaitianHmongHonduranHopiHoumaHungarianIcelanderIndian (Asian)IndonesianInupiatIranianIraqiIrishIroquoisIsraeliItalianJamaicanJapaneseJordanianKenyanKiowaKoreanLaotianLatvianLebaneseLiberianLithuanianLumbeeLuxembourgerMacedonianMalaysianMalteseMarshalleseMenomineeMexicanMexican American IndianMongolianMoroccanNative HawaiianNavajoNepaleseNew ZealanderNicaraguanNigerianNorthern EuropeanNorwegianOkinawanOsageOttawaPaiutePakistaniPalestinianPanamanianParaguayanPennsylvania GermanPeruvianPimaPolishPortuguesePotawatomiPuebloPuerto RicanPuget Sound SalishRomanianRussianSalvadoranSamoanScandinavianScotch-IrishScottishSeminoleSenegaleseSerbianShoshoneSierra LeoneanSiouxSlavicSlovakSloveneSomaliSouth AfricanSouth AmericanSouth American IndianSoviet UnionSpaniardSpanishSpanish AmericanSpanish American IndianSri LankanSubsaharan AfricanSudaneseSwedishSwissSyrianTaiwaneseThaiTlingit-HaidaTohono O'OdhamTonganTrinidadian and TobagonianTsimshianTurkishU.S. Virgin IslanderUgandanUkrainianUruguayanUteVenezuelanVietnameseWelshWest IndianYakamaYaquiYugoslavianYumanYup'ik
Immigration
NonimmigrantsImmigrantsAfghanistanAfricaAlbaniaArgentinaArmeniaAsiaAustraliaAustriaBahamasBangladeshBarbadosBelarusBelgiumBelizeBoliviaBosnia and HerzegovinaBrazilBulgariaBurma/MyanmarCabo VerdeCambodiaCameroonCanadaCaribbeanCentral AmericaChileChinaColombiaCongoCosta RicaCroatiaCubaCzechoslovakiaDenmarkDominicaDominican RepublicEastern AfricaEastern AsiaEastern EuropeEcuadorEgyptEl SalvadorEnglandEritreaEthiopiaEuropeFijiFranceGermanyGhanaGreeceGrenadaGuatemalaGuyanaHaitiHondurasHong KongHungaryIndiaIndonesiaIranIraqIrelandIsraelItalyJamaicaJapanJordanKazakhstanKenyaKoreaKuwaitLaosLatin AmericaLatviaLebanonLiberiaLithuaniaMalaysiaMexicoMicronesiaMiddle AfricaMoldovaMoroccoNepalNetherlandsNicaraguaNigeriaNorth AmericaNorth MacedoniaNorthern AfricaNorthern EuropeNorwayOceaniaPakistanPanamaPeruPhilippinesPolandPortugalRomaniaRussiaSaudi ArabiaScotlandSenegalSerbiaSierra LeoneSingaporeSomaliaSouth AfricaSouth AmericaSouth Central AsiaSouth Eastern AsiaSouthern EuropeSpainSri LankaSt. Vincent and the GrenadinesSudanSwedenSwitzerlandSyriaTaiwanThailandTrinidad and TobagoTurkeyUgandaUkraineUruguayUzbekistanVenezuelaVietnamWest IndiesWestern AfricaWestern AsiaWestern EuropeYemenZaireZimbabweAzores
Unemployment Among Ages 45 to 54 years
Income
Poverty
Unemployment
Labor Participation
Family Structure
Vehicle Availability
Education Level
Disability

Unemployment Among Ages 45 to 54 years Comparison

Zimbabweans

Immigrants from South America

Exceptional
Poor
4.2%
UNEMPLOYMENT AMONG AGES 45 TO 54 YEARS
99.8/ 100
METRIC RATING
43rd/ 347
METRIC RANK
4.6%
UNEMPLOYMENT AMONG AGES 45 TO 54 YEARS
12.2/ 100
METRIC RATING
210th/ 347
METRIC RANK

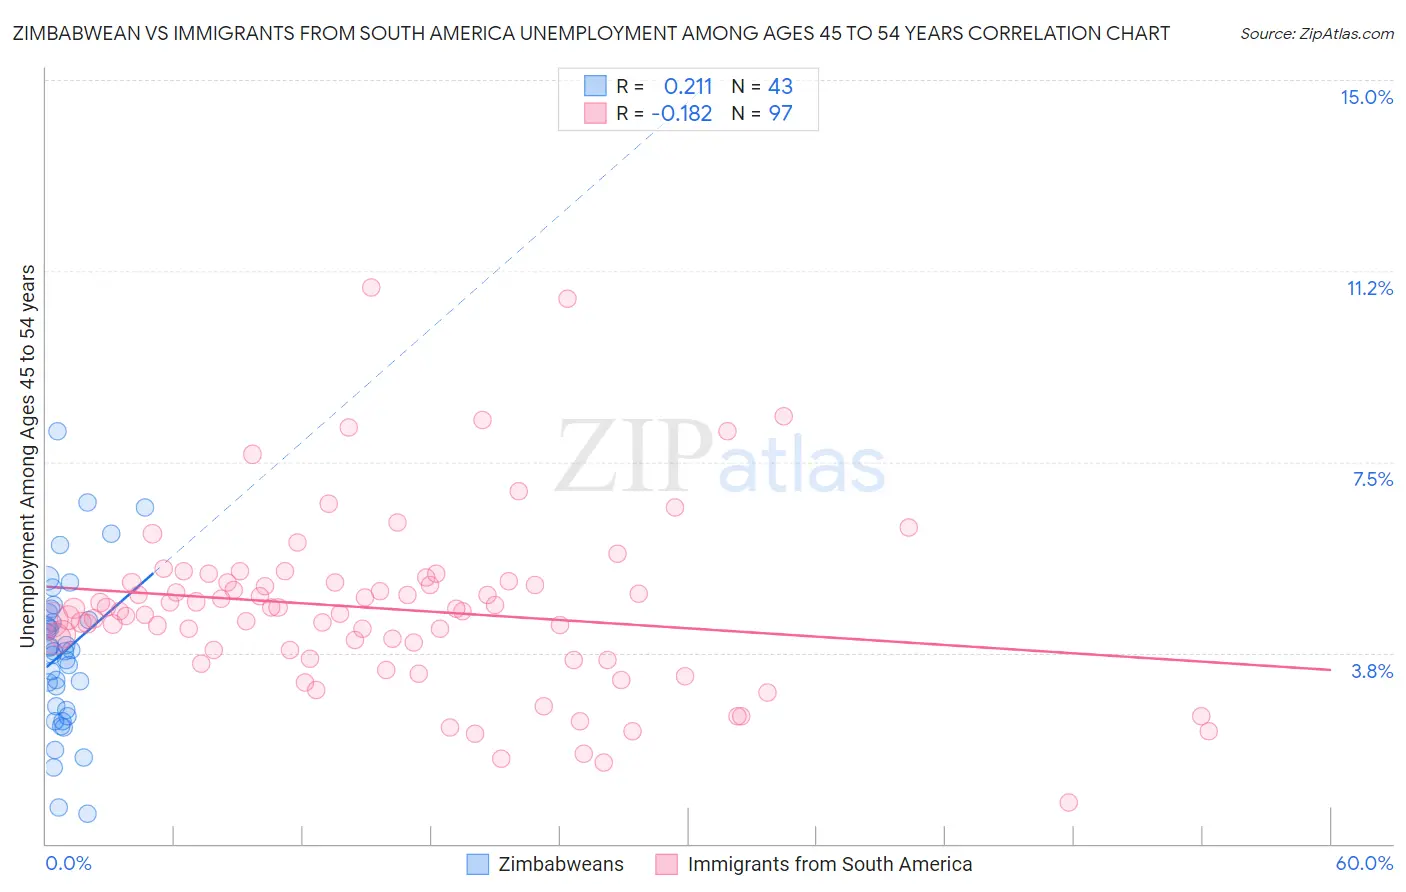
Zimbabwean vs Immigrants from South America Unemployment Among Ages 45 to 54 years Correlation Chart

The statistical analysis conducted on geographies consisting of 68,871,465 people shows a weak positive correlation between the proportion of Zimbabweans and unemployment rate among population between the ages 45 and 54 in the United States with a correlation coefficient (R) of 0.211 and weighted average of 4.2%. Similarly, the statistical analysis conducted on geographies consisting of 468,349,404 people shows a poor negative correlation between the proportion of Immigrants from South America and unemployment rate among population between the ages 45 and 54 in the United States with a correlation coefficient (R) of -0.182 and weighted average of 4.6%, a difference of 10.0%.
Zimbabwean vs Immigrants from South America Unemployment Among Ages 45 to 54 years

Unemployment Among Ages 45 to 54 years Correlation Summary

MeasurementZimbabweanImmigrants from South America
Minimum0.60%0.80%
Maximum8.1%10.9%
Range7.5%10.1%
Mean3.8%4.6%
Median3.8%4.6%
Interquartile 25% (IQ1)2.6%3.7%
Interquartile 75% (IQ3)4.5%5.1%
Interquartile Range (IQR)1.9%1.4%
Standard Deviation (Sample)1.6%1.7%
Standard Deviation (Population)1.5%1.7%

Similar Demographics by Unemployment Among Ages 45 to 54 years

Demographics Similar to Zimbabweans by Unemployment Among Ages 45 to 54 years

In terms of unemployment among ages 45 to 54 years, the demographic groups most similar to Zimbabweans are Immigrants from Scotland (4.2%, a difference of 0.010%), Czechoslovakian (4.2%, a difference of 0.050%), Northern European (4.2%, a difference of 0.070%), Immigrants from Singapore (4.2%, a difference of 0.26%), and Jordanian (4.2%, a difference of 0.27%).
DemographicsRating | RankUnemployment Among Ages 45 to 54 years
Croatians
99.8
/100
|
#36
Exceptional
4.2%
Osage
99.8
/100
|
#37
Exceptional
4.2%
Scotch-Irish
99.8
/100
|
#38
Exceptional
4.2%
Jordanians
99.8
/100
|
#39
Exceptional
4.2%
Northern Europeans
99.8
/100
|
#40
Exceptional
4.2%
Czechoslovakians
99.8
/100
|
#41
Exceptional
4.2%
Immigrants | Scotland
99.8
/100
|
#42
Exceptional
4.2%
Zimbabweans
99.8
/100
|
#43
Exceptional
4.2%
Immigrants | Singapore
99.7
/100
|
#44
Exceptional
4.2%
Immigrants | Bulgaria
99.7
/100
|
#45
Exceptional
4.2%
Luxembourgers
99.6
/100
|
#46
Exceptional
4.2%
Filipinos
99.6
/100
|
#47
Exceptional
4.2%
Finns
99.6
/100
|
#48
Exceptional
4.2%
Immigrants | Zimbabwe
99.6
/100
|
#49
Exceptional
4.2%
Basques
99.6
/100
|
#50
Exceptional
4.2%

Demographics Similar to Immigrants from South America by Unemployment Among Ages 45 to 54 years

In terms of unemployment among ages 45 to 54 years, the demographic groups most similar to Immigrants from South America are Creek (4.6%, a difference of 0.040%), Immigrants from Iran (4.6%, a difference of 0.070%), Immigrants from Nigeria (4.6%, a difference of 0.11%), Immigrants from Africa (4.6%, a difference of 0.14%), and Arab (4.6%, a difference of 0.15%).
DemographicsRating | RankUnemployment Among Ages 45 to 54 years
Liberians
18.7
/100
|
#203
Poor
4.6%
Immigrants | Morocco
16.8
/100
|
#204
Poor
4.6%
Immigrants | Greece
16.2
/100
|
#205
Poor
4.6%
Immigrants | Switzerland
14.0
/100
|
#206
Poor
4.6%
Arabs
13.7
/100
|
#207
Poor
4.6%
Immigrants | Africa
13.6
/100
|
#208
Poor
4.6%
Immigrants | Nigeria
13.3
/100
|
#209
Poor
4.6%
Immigrants | South America
12.2
/100
|
#210
Poor
4.6%
Creek
11.9
/100
|
#211
Poor
4.6%
Immigrants | Iran
11.5
/100
|
#212
Poor
4.6%
Panamanians
10.7
/100
|
#213
Poor
4.6%
Cherokee
10.6
/100
|
#214
Poor
4.6%
Immigrants | Panama
10.4
/100
|
#215
Poor
4.6%
Lumbee
9.2
/100
|
#216
Tragic
4.6%
Immigrants | Cambodia
7.4
/100
|
#217
Tragic
4.7%