Zimbabwean vs Crow Unemployment Among Women with Children Under 6 years
COMPARE
Zimbabwean
Crow
Unemployment Among Women with Children Under 6 years
Unemployment Among Women with Children Under 6 years Comparison
Zimbabweans
Crow
7.3%
UNEMPLOYMENT AMONG WOMEN WITH CHILDREN UNDER 6 YEARS
91.5/ 100
METRIC RATING
128th/ 347
METRIC RANK
14.6%
UNEMPLOYMENT AMONG WOMEN WITH CHILDREN UNDER 6 YEARS
0.0/ 100
METRIC RATING
343rd/ 347
METRIC RANK
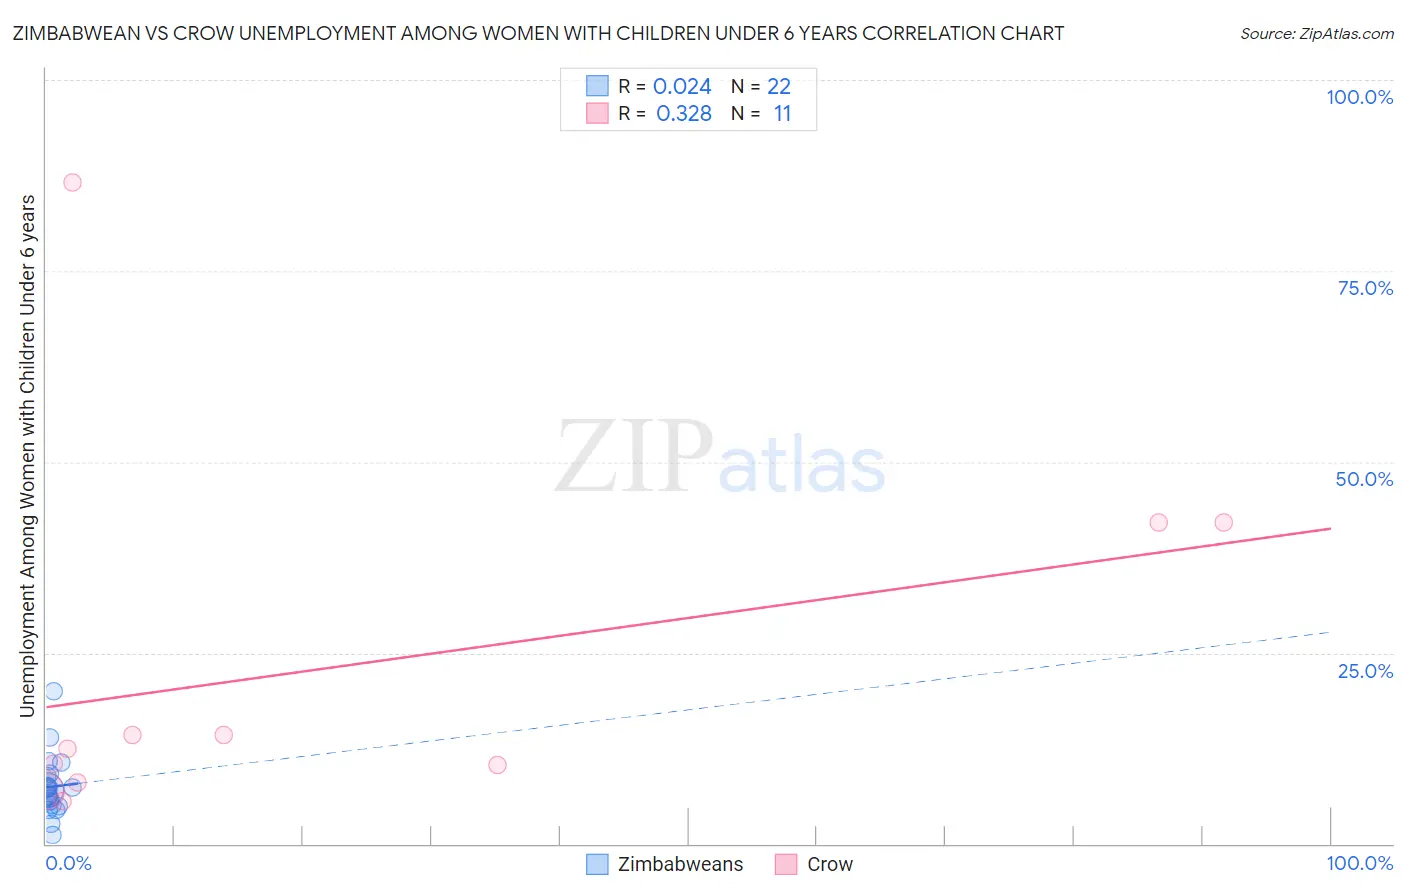
Zimbabwean vs Crow Unemployment Among Women with Children Under 6 years Correlation Chart
The statistical analysis conducted on geographies consisting of 63,906,622 people shows no correlation between the proportion of Zimbabweans and unemployment rate among women with children under the age of 6 in the United States with a correlation coefficient (R) of 0.024 and weighted average of 7.3%. Similarly, the statistical analysis conducted on geographies consisting of 53,848,847 people shows a mild positive correlation between the proportion of Crow and unemployment rate among women with children under the age of 6 in the United States with a correlation coefficient (R) of 0.328 and weighted average of 14.6%, a difference of 99.3%.
Unemployment Among Women with Children Under 6 years Correlation Summary
| Measurement | Zimbabwean | Crow |
| Minimum | 1.2% | 5.6% |
| Maximum | 20.0% | 86.6% |
| Range | 18.8% | 81.1% |
| Mean | 7.5% | 23.0% |
| Median | 7.1% | 12.5% |
| Interquartile 25% (IQ1) | 5.1% | 8.1% |
| Interquartile 75% (IQ3) | 8.9% | 42.1% |
| Interquartile Range (IQR) | 3.7% | 34.0% |
| Standard Deviation (Sample) | 3.9% | 24.8% |
| Standard Deviation (Population) | 3.9% | 23.6% |
Similar Demographics by Unemployment Among Women with Children Under 6 years
Demographics Similar to Zimbabweans by Unemployment Among Women with Children Under 6 years
In terms of unemployment among women with children under 6 years, the demographic groups most similar to Zimbabweans are Jordanian (7.3%, a difference of 0.0%), Immigrants from Burma/Myanmar (7.3%, a difference of 0.10%), Pakistani (7.3%, a difference of 0.17%), Immigrants from South Africa (7.3%, a difference of 0.25%), and Immigrants from Zaire (7.3%, a difference of 0.45%).
| Demographics | Rating | Rank | Unemployment Among Women with Children Under 6 years |
| Immigrants | Chile | 93.5 /100 | #121 | Exceptional 7.3% |
| Immigrants | Bosnia and Herzegovina | 93.5 /100 | #122 | Exceptional 7.3% |
| Immigrants | Zaire | 93.3 /100 | #123 | Exceptional 7.3% |
| Immigrants | South Africa | 92.5 /100 | #124 | Exceptional 7.3% |
| Pakistanis | 92.2 /100 | #125 | Exceptional 7.3% |
| Immigrants | Burma/Myanmar | 91.9 /100 | #126 | Exceptional 7.3% |
| Jordanians | 91.5 /100 | #127 | Exceptional 7.3% |
| Zimbabweans | 91.5 /100 | #128 | Exceptional 7.3% |
| Slovenes | 89.2 /100 | #129 | Excellent 7.4% |
| Swedes | 88.4 /100 | #130 | Excellent 7.4% |
| Ukrainians | 88.2 /100 | #131 | Excellent 7.4% |
| Immigrants | Armenia | 87.4 /100 | #132 | Excellent 7.4% |
| Immigrants | Uganda | 86.5 /100 | #133 | Excellent 7.4% |
| Immigrants | Bolivia | 85.7 /100 | #134 | Excellent 7.4% |
| Immigrants | Northern Africa | 85.3 /100 | #135 | Excellent 7.4% |
Demographics Similar to Crow by Unemployment Among Women with Children Under 6 years
In terms of unemployment among women with children under 6 years, the demographic groups most similar to Crow are Yuman (14.6%, a difference of 0.090%), Lumbee (13.8%, a difference of 6.1%), Immigrants from Yemen (13.5%, a difference of 8.5%), Navajo (13.5%, a difference of 8.5%), and Pima (13.4%, a difference of 8.9%).
| Demographics | Rating | Rank | Unemployment Among Women with Children Under 6 years |
| Natives/Alaskans | 0.0 /100 | #333 | Tragic 11.5% |
| Apache | 0.0 /100 | #334 | Tragic 12.3% |
| Puerto Ricans | 0.0 /100 | #335 | Tragic 12.5% |
| Shoshone | 0.0 /100 | #336 | Tragic 13.2% |
| Chippewa | 0.0 /100 | #337 | Tragic 13.3% |
| Pima | 0.0 /100 | #338 | Tragic 13.4% |
| Navajo | 0.0 /100 | #339 | Tragic 13.5% |
| Immigrants | Yemen | 0.0 /100 | #340 | Tragic 13.5% |
| Lumbee | 0.0 /100 | #341 | Tragic 13.8% |
| Yuman | 0.0 /100 | #342 | Tragic 14.6% |
| Crow | 0.0 /100 | #343 | Tragic 14.6% |
| Hopi | 0.0 /100 | #344 | Tragic 16.8% |
| Inupiat | 0.0 /100 | #345 | Tragic 17.7% |
| Arapaho | 0.0 /100 | #346 | Tragic 19.0% |
| Yup'ik | 0.0 /100 | #347 | Tragic 21.1% |