Tongan vs Tsimshian Unemployment
COMPARE
Tongan
Tsimshian
Unemployment
Unemployment Comparison
Tongans
Tsimshian
4.8%
UNEMPLOYMENT
99.7/ 100
METRIC RATING
36th/ 347
METRIC RANK
7.2%
UNEMPLOYMENT
0.0/ 100
METRIC RATING
328th/ 347
METRIC RANK
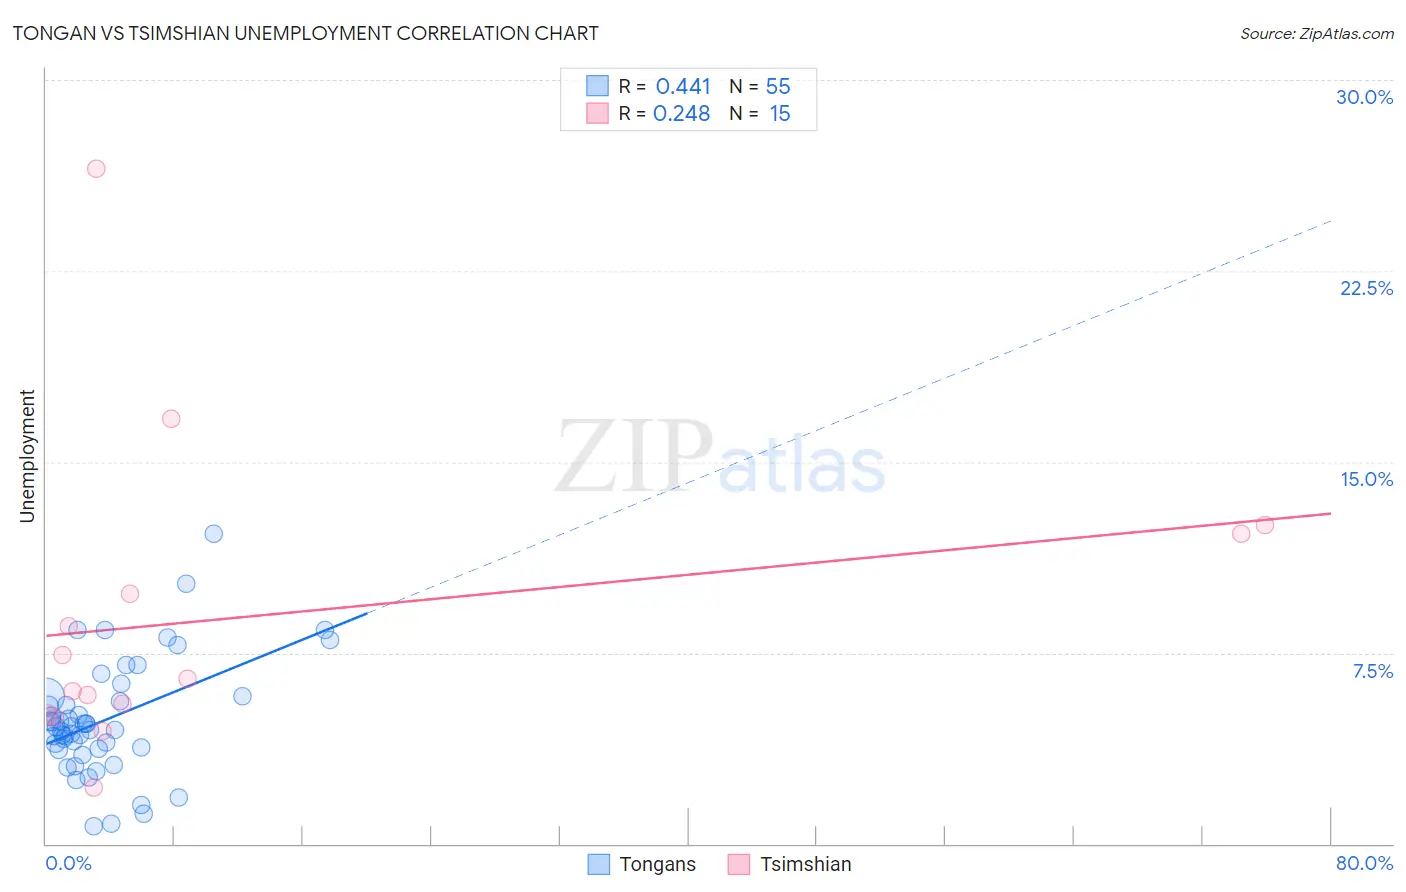
Tongan vs Tsimshian Unemployment Correlation Chart
The statistical analysis conducted on geographies consisting of 102,862,853 people shows a moderate positive correlation between the proportion of Tongans and unemployment in the United States with a correlation coefficient (R) of 0.441 and weighted average of 4.8%. Similarly, the statistical analysis conducted on geographies consisting of 15,625,029 people shows a weak positive correlation between the proportion of Tsimshian and unemployment in the United States with a correlation coefficient (R) of 0.248 and weighted average of 7.2%, a difference of 51.0%.
Unemployment Correlation Summary
| Measurement | Tongan | Tsimshian |
| Minimum | 0.66% | 2.2% |
| Maximum | 12.2% | 26.5% |
| Range | 11.5% | 24.3% |
| Mean | 4.9% | 8.9% |
| Median | 4.6% | 6.5% |
| Interquartile 25% (IQ1) | 3.7% | 5.1% |
| Interquartile 75% (IQ3) | 5.8% | 12.2% |
| Interquartile Range (IQR) | 2.1% | 7.1% |
| Standard Deviation (Sample) | 2.2% | 6.1% |
| Standard Deviation (Population) | 2.2% | 5.9% |
Similar Demographics by Unemployment
Demographics Similar to Tongans by Unemployment
In terms of unemployment, the demographic groups most similar to Tongans are Czechoslovakian (4.8%, a difference of 0.070%), Scotch-Irish (4.8%, a difference of 0.22%), Bolivian (4.8%, a difference of 0.26%), Immigrants from Bolivia (4.8%, a difference of 0.30%), and Sudanese (4.8%, a difference of 0.33%).
| Demographics | Rating | Rank | Unemployment |
| Poles | 99.8 /100 | #29 | Exceptional 4.7% |
| Irish | 99.8 /100 | #30 | Exceptional 4.8% |
| Croatians | 99.8 /100 | #31 | Exceptional 4.8% |
| Zimbabweans | 99.8 /100 | #32 | Exceptional 4.8% |
| Sudanese | 99.8 /100 | #33 | Exceptional 4.8% |
| Immigrants | Bolivia | 99.8 /100 | #34 | Exceptional 4.8% |
| Scotch-Irish | 99.8 /100 | #35 | Exceptional 4.8% |
| Tongans | 99.7 /100 | #36 | Exceptional 4.8% |
| Czechoslovakians | 99.7 /100 | #37 | Exceptional 4.8% |
| Bolivians | 99.7 /100 | #38 | Exceptional 4.8% |
| Lithuanians | 99.7 /100 | #39 | Exceptional 4.8% |
| Northern Europeans | 99.7 /100 | #40 | Exceptional 4.8% |
| Immigrants | Bosnia and Herzegovina | 99.7 /100 | #41 | Exceptional 4.8% |
| Filipinos | 99.5 /100 | #42 | Exceptional 4.8% |
| Yugoslavians | 99.5 /100 | #43 | Exceptional 4.8% |
Demographics Similar to Tsimshian by Unemployment
In terms of unemployment, the demographic groups most similar to Tsimshian are Alaska Native (7.2%, a difference of 0.31%), Pueblo (7.2%, a difference of 0.91%), Paiute (7.1%, a difference of 1.4%), Yakama (7.3%, a difference of 1.6%), and Dominican (7.4%, a difference of 1.9%).
| Demographics | Rating | Rank | Unemployment |
| Immigrants | Guyana | 0.0 /100 | #321 | Tragic 6.9% |
| Guyanese | 0.0 /100 | #322 | Tragic 6.9% |
| Immigrants | Grenada | 0.0 /100 | #323 | Tragic 6.9% |
| Immigrants | Armenia | 0.0 /100 | #324 | Tragic 7.0% |
| Natives/Alaskans | 0.0 /100 | #325 | Tragic 7.0% |
| Paiute | 0.0 /100 | #326 | Tragic 7.1% |
| Pueblo | 0.0 /100 | #327 | Tragic 7.2% |
| Tsimshian | 0.0 /100 | #328 | Tragic 7.2% |
| Alaska Natives | 0.0 /100 | #329 | Tragic 7.2% |
| Yakama | 0.0 /100 | #330 | Tragic 7.3% |
| Dominicans | 0.0 /100 | #331 | Tragic 7.4% |
| Sioux | 0.0 /100 | #332 | Tragic 7.4% |
| Immigrants | Dominican Republic | 0.0 /100 | #333 | Tragic 7.4% |
| Apache | 0.0 /100 | #334 | Tragic 7.4% |
| Alaskan Athabascans | 0.0 /100 | #335 | Tragic 7.7% |