Tohono O'odham vs Shoshone Unemployment Among Ages 60 to 64 years
COMPARE
Tohono O'odham
Shoshone
Unemployment Among Ages 60 to 64 years
Unemployment Among Ages 60 to 64 years Comparison
Tohono O'odham
Shoshone
5.0%
UNEMPLOYMENT AMONG AGES 60 TO 64 YEARS
5.7/ 100
METRIC RATING
231st/ 347
METRIC RANK
5.7%
UNEMPLOYMENT AMONG AGES 60 TO 64 YEARS
0.0/ 100
METRIC RATING
317th/ 347
METRIC RANK
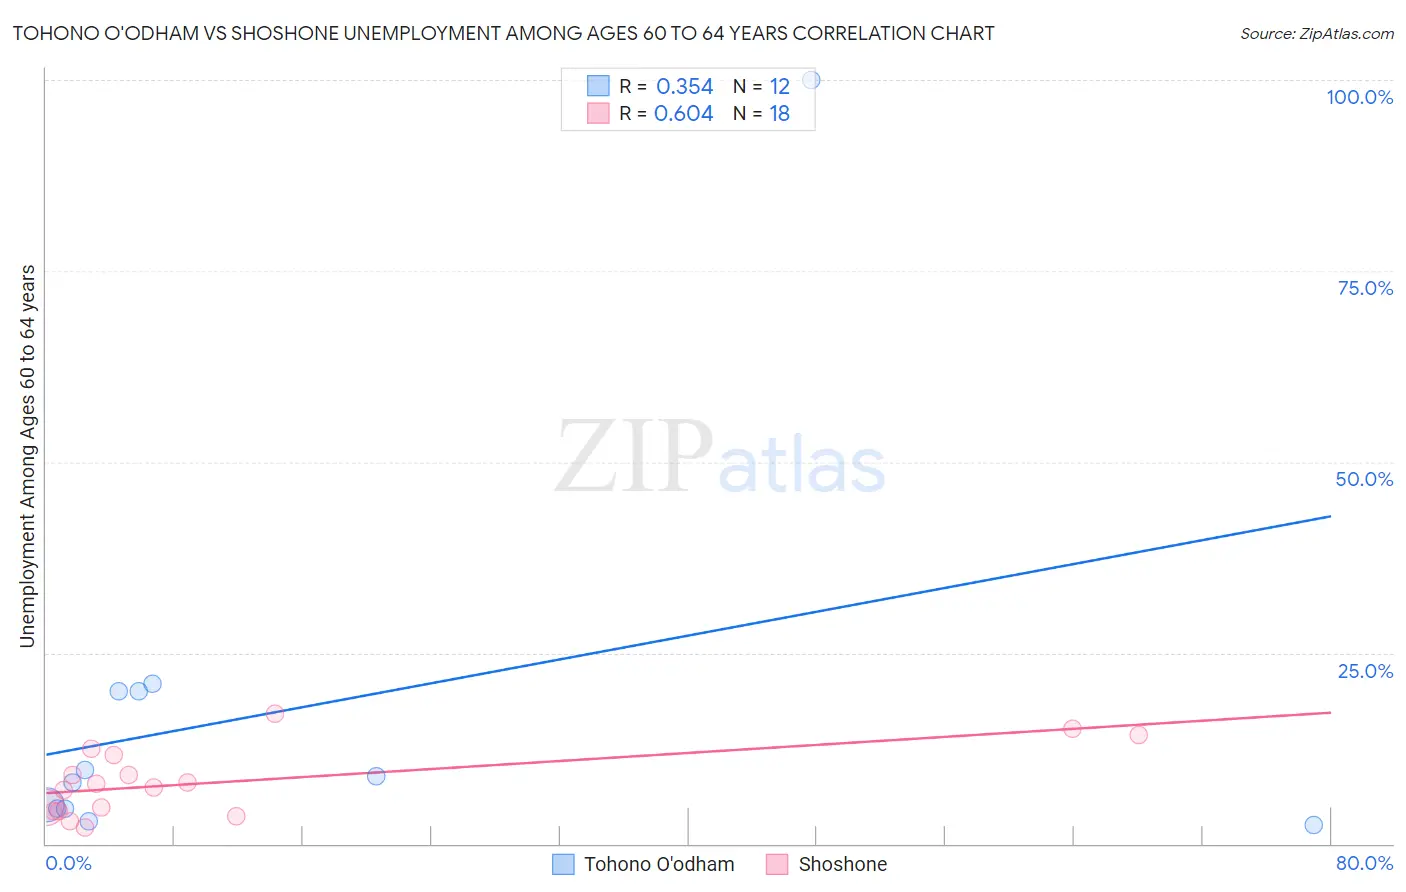
Tohono O'odham vs Shoshone Unemployment Among Ages 60 to 64 years Correlation Chart
The statistical analysis conducted on geographies consisting of 57,527,437 people shows a mild positive correlation between the proportion of Tohono O'odham and unemployment rate among population between the ages 60 and 64 in the United States with a correlation coefficient (R) of 0.354 and weighted average of 5.0%. Similarly, the statistical analysis conducted on geographies consisting of 63,439,226 people shows a significant positive correlation between the proportion of Shoshone and unemployment rate among population between the ages 60 and 64 in the United States with a correlation coefficient (R) of 0.604 and weighted average of 5.7%, a difference of 13.7%.
Unemployment Among Ages 60 to 64 years Correlation Summary
| Measurement | Tohono O'odham | Shoshone |
| Minimum | 2.5% | 2.1% |
| Maximum | 100.0% | 17.1% |
| Range | 97.5% | 15.0% |
| Mean | 17.3% | 8.1% |
| Median | 8.5% | 7.5% |
| Interquartile 25% (IQ1) | 4.6% | 4.3% |
| Interquartile 75% (IQ3) | 19.9% | 11.6% |
| Interquartile Range (IQR) | 15.4% | 7.3% |
| Standard Deviation (Sample) | 26.9% | 4.4% |
| Standard Deviation (Population) | 25.8% | 4.3% |
Similar Demographics by Unemployment Among Ages 60 to 64 years
Demographics Similar to Tohono O'odham by Unemployment Among Ages 60 to 64 years
In terms of unemployment among ages 60 to 64 years, the demographic groups most similar to Tohono O'odham are Immigrants from Denmark (5.0%, a difference of 0.0%), African (5.0%, a difference of 0.030%), Immigrants from Belarus (5.0%, a difference of 0.10%), Nigerian (5.0%, a difference of 0.15%), and Immigrants from Chile (5.0%, a difference of 0.16%).
| Demographics | Rating | Rank | Unemployment Among Ages 60 to 64 years |
| Immigrants | Cameroon | 8.5 /100 | #224 | Tragic 5.0% |
| Immigrants | Ireland | 7.2 /100 | #225 | Tragic 5.0% |
| Immigrants | Chile | 6.8 /100 | #226 | Tragic 5.0% |
| Nigerians | 6.8 /100 | #227 | Tragic 5.0% |
| Immigrants | Belarus | 6.4 /100 | #228 | Tragic 5.0% |
| Africans | 5.9 /100 | #229 | Tragic 5.0% |
| Immigrants | Denmark | 5.8 /100 | #230 | Tragic 5.0% |
| Tohono O'odham | 5.7 /100 | #231 | Tragic 5.0% |
| Immigrants | Eastern Asia | 4.7 /100 | #232 | Tragic 5.0% |
| Immigrants | Greece | 4.6 /100 | #233 | Tragic 5.0% |
| Iranians | 4.2 /100 | #234 | Tragic 5.0% |
| Delaware | 3.6 /100 | #235 | Tragic 5.0% |
| Immigrants | Sierra Leone | 3.1 /100 | #236 | Tragic 5.0% |
| Immigrants | Western Asia | 3.0 /100 | #237 | Tragic 5.0% |
| Immigrants | Poland | 3.0 /100 | #238 | Tragic 5.0% |
Demographics Similar to Shoshone by Unemployment Among Ages 60 to 64 years
In terms of unemployment among ages 60 to 64 years, the demographic groups most similar to Shoshone are Native/Alaskan (5.7%, a difference of 0.050%), Immigrants from Belize (5.7%, a difference of 0.54%), Cheyenne (5.6%, a difference of 0.87%), Cree (5.6%, a difference of 1.2%), and Colville (5.7%, a difference of 1.3%).
| Demographics | Rating | Rank | Unemployment Among Ages 60 to 64 years |
| British West Indians | 0.0 /100 | #310 | Tragic 5.5% |
| U.S. Virgin Islanders | 0.0 /100 | #311 | Tragic 5.5% |
| Immigrants | West Indies | 0.0 /100 | #312 | Tragic 5.5% |
| Belizeans | 0.0 /100 | #313 | Tragic 5.5% |
| Guyanese | 0.0 /100 | #314 | Tragic 5.5% |
| Cree | 0.0 /100 | #315 | Tragic 5.6% |
| Cheyenne | 0.0 /100 | #316 | Tragic 5.6% |
| Shoshone | 0.0 /100 | #317 | Tragic 5.7% |
| Natives/Alaskans | 0.0 /100 | #318 | Tragic 5.7% |
| Immigrants | Belize | 0.0 /100 | #319 | Tragic 5.7% |
| Colville | 0.0 /100 | #320 | Tragic 5.7% |
| Dutch West Indians | 0.0 /100 | #321 | Tragic 5.7% |
| Ecuadorians | 0.0 /100 | #322 | Tragic 5.8% |
| Alsatians | 0.0 /100 | #323 | Tragic 5.8% |
| Immigrants | Ecuador | 0.0 /100 | #324 | Tragic 5.8% |