Tohono O'odham vs Immigrants from Oceania Unemployment Among Ages 60 to 64 years

COMPARE

Tohono O'odham
Race
Ancestry
AfghanAfricanAlaska NativeAlaskan AthabascanAlbanianAleutAlsatianAmericanApacheArabArapahoArgentineanArmenianAssyrian/Chaldean/SyriacAustralianAustrianBahamianBangladeshiBarbadianBasqueBelgianBelizeanBermudanBhutaneseBlackfeetBolivianBrazilianBritishBritish West IndianBulgarianBurmeseCajunCambodianCanadianCape VerdeanCarpatho RusynCelticCentral AmericanCentral American IndianCherokeeCheyenneChickasawChileanChineseChippewaChoctawColombianColvilleComancheCosta RicanCreeCreekCroatianCrowCubanCypriotCzechCzechoslovakianDanishDelawareDominicanDutchDutch West IndianEastern EuropeanEcuadorianEgyptianEnglishEstonianEthiopianEuropeanFijianFilipinoFinnishFrenchFrench American IndianFrench CanadianGermanGerman RussianGhanaianGreekGuamanian/ChamorroGuatemalanGuyaneseHaitianHmongHonduranHopiHoumaHungarianIcelanderIndian (Asian)IndonesianInupiatIranianIraqiIrishIroquoisIsraeliItalianJamaicanJapaneseJordanianKenyanKiowaKoreanLaotianLatvianLebaneseLiberianLithuanianLumbeeLuxembourgerMacedonianMalaysianMalteseMarshalleseMenomineeMexicanMexican American IndianMongolianMoroccanNative HawaiianNavajoNepaleseNew ZealanderNicaraguanNigerianNorthern EuropeanNorwegianOkinawanOsageOttawaPaiutePakistaniPalestinianPanamanianParaguayanPennsylvania GermanPeruvianPimaPolishPortuguesePotawatomiPuebloPuerto RicanPuget Sound SalishRomanianRussianSalvadoranSamoanScandinavianScotch-IrishScottishSeminoleSenegaleseSerbianShoshoneSierra LeoneanSiouxSlavicSlovakSloveneSomaliSouth AfricanSouth AmericanSouth American IndianSoviet UnionSpaniardSpanishSpanish AmericanSpanish American IndianSri LankanSubsaharan AfricanSudaneseSwedishSwissSyrianTaiwaneseThaiTlingit-HaidaTohono O'OdhamTonganTrinidadian and TobagonianTsimshianTurkishU.S. Virgin IslanderUgandanUkrainianUruguayanUteVenezuelanVietnameseWelshWest IndianYakamaYaquiYugoslavianYumanYup'ikZimbabwean
Immigration
NonimmigrantsImmigrantsAfghanistanAfricaAlbaniaArgentinaArmeniaAsiaAustraliaAustriaBahamasBangladeshBarbadosBelarusBelgiumBelizeBoliviaBosnia and HerzegovinaBrazilBulgariaBurma/MyanmarCabo VerdeCambodiaCameroonCanadaCaribbeanCentral AmericaChileChinaColombiaCongoCosta RicaCroatiaCubaCzechoslovakiaDenmarkDominicaDominican RepublicEastern AfricaEastern AsiaEastern EuropeEcuadorEgyptEl SalvadorEnglandEritreaEthiopiaEuropeFijiFranceGermanyGhanaGreeceGrenadaGuatemalaGuyanaHaitiHondurasHong KongHungaryIndiaIndonesiaIranIraqIrelandIsraelItalyJamaicaJapanJordanKazakhstanKenyaKoreaKuwaitLaosLatin AmericaLatviaLebanonLiberiaLithuaniaMalaysiaMexicoMicronesiaMiddle AfricaMoldovaMoroccoNepalNetherlandsNicaraguaNigeriaNorth AmericaNorth MacedoniaNorthern AfricaNorthern EuropeNorwayPakistanPanamaPeruPhilippinesPolandPortugalRomaniaRussiaSaudi ArabiaScotlandSenegalSerbiaSierra LeoneSingaporeSomaliaSouth AfricaSouth AmericaSouth Central AsiaSouth Eastern AsiaSouthern EuropeSpainSri LankaSt. Vincent and the GrenadinesSudanSwedenSwitzerlandSyriaTaiwanThailandTrinidad and TobagoTurkeyUgandaUkraineUruguayUzbekistanVenezuelaVietnamWest IndiesWestern AfricaWestern AsiaWestern EuropeYemenZaireZimbabweAzores
Immigrants from Oceania
Race
Ancestry
AfghanAfricanAlaska NativeAlaskan AthabascanAlbanianAleutAlsatianAmericanApacheArabArapahoArgentineanArmenianAssyrian/Chaldean/SyriacAustralianAustrianBahamianBangladeshiBarbadianBasqueBelgianBelizeanBermudanBhutaneseBlackfeetBolivianBrazilianBritishBritish West IndianBulgarianBurmeseCajunCambodianCanadianCape VerdeanCarpatho RusynCelticCentral AmericanCentral American IndianCherokeeCheyenneChickasawChileanChineseChippewaChoctawColombianColvilleComancheCosta RicanCreeCreekCroatianCrowCubanCypriotCzechCzechoslovakianDanishDelawareDominicanDutchDutch West IndianEastern EuropeanEcuadorianEgyptianEnglishEstonianEthiopianEuropeanFijianFilipinoFinnishFrenchFrench American IndianFrench CanadianGermanGerman RussianGhanaianGreekGuamanian/ChamorroGuatemalanGuyaneseHaitianHmongHonduranHopiHoumaHungarianIcelanderIndian (Asian)IndonesianInupiatIranianIraqiIrishIroquoisIsraeliItalianJamaicanJapaneseJordanianKenyanKiowaKoreanLaotianLatvianLebaneseLiberianLithuanianLumbeeLuxembourgerMacedonianMalaysianMalteseMarshalleseMenomineeMexicanMexican American IndianMongolianMoroccanNative HawaiianNavajoNepaleseNew ZealanderNicaraguanNigerianNorthern EuropeanNorwegianOkinawanOsageOttawaPaiutePakistaniPalestinianPanamanianParaguayanPennsylvania GermanPeruvianPimaPolishPortuguesePotawatomiPuebloPuerto RicanPuget Sound SalishRomanianRussianSalvadoranSamoanScandinavianScotch-IrishScottishSeminoleSenegaleseSerbianShoshoneSierra LeoneanSiouxSlavicSlovakSloveneSomaliSouth AfricanSouth AmericanSouth American IndianSoviet UnionSpaniardSpanishSpanish AmericanSpanish American IndianSri LankanSubsaharan AfricanSudaneseSwedishSwissSyrianTaiwaneseThaiTlingit-HaidaTonganTrinidadian and TobagonianTsimshianTurkishU.S. Virgin IslanderUgandanUkrainianUruguayanUteVenezuelanVietnameseWelshWest IndianYakamaYaquiYugoslavianYumanYup'ikZimbabwean
Immigration
NonimmigrantsImmigrantsAfghanistanAfricaAlbaniaArgentinaArmeniaAsiaAustraliaAustriaBahamasBangladeshBarbadosBelarusBelgiumBelizeBoliviaBosnia and HerzegovinaBrazilBulgariaBurma/MyanmarCabo VerdeCambodiaCameroonCanadaCaribbeanCentral AmericaChileChinaColombiaCongoCosta RicaCroatiaCubaCzechoslovakiaDenmarkDominicaDominican RepublicEastern AfricaEastern AsiaEastern EuropeEcuadorEgyptEl SalvadorEnglandEritreaEthiopiaEuropeFijiFranceGermanyGhanaGreeceGrenadaGuatemalaGuyanaHaitiHondurasHong KongHungaryIndiaIndonesiaIranIraqIrelandIsraelItalyJamaicaJapanJordanKazakhstanKenyaKoreaKuwaitLaosLatin AmericaLatviaLebanonLiberiaLithuaniaMalaysiaMexicoMicronesiaMiddle AfricaMoldovaMoroccoNepalNetherlandsNicaraguaNigeriaNorth AmericaNorth MacedoniaNorthern AfricaNorthern EuropeNorwayOceaniaPakistanPanamaPeruPhilippinesPolandPortugalRomaniaRussiaSaudi ArabiaScotlandSenegalSerbiaSierra LeoneSingaporeSomaliaSouth AfricaSouth AmericaSouth Central AsiaSouth Eastern AsiaSouthern EuropeSpainSri LankaSt. Vincent and the GrenadinesSudanSwedenSwitzerlandSyriaTaiwanThailandTrinidad and TobagoTurkeyUgandaUkraineUruguayUzbekistanVenezuelaVietnamWest IndiesWestern AfricaWestern AsiaWestern EuropeYemenZaireZimbabweAzores
Unemployment Among Ages 60 to 64 years
Income
Poverty
Unemployment
Labor Participation
Family Structure
Vehicle Availability
Education Level
Disability

Unemployment Among Ages 60 to 64 years Comparison

Tohono O'odham

Immigrants from Oceania

Tragic
Exceptional
5.0%
UNEMPLOYMENT AMONG AGES 60 TO 64 YEARS
5.7/ 100
METRIC RATING
231st/ 347
METRIC RANK
4.7%
UNEMPLOYMENT AMONG AGES 60 TO 64 YEARS
98.9/ 100
METRIC RATING
86th/ 347
METRIC RANK

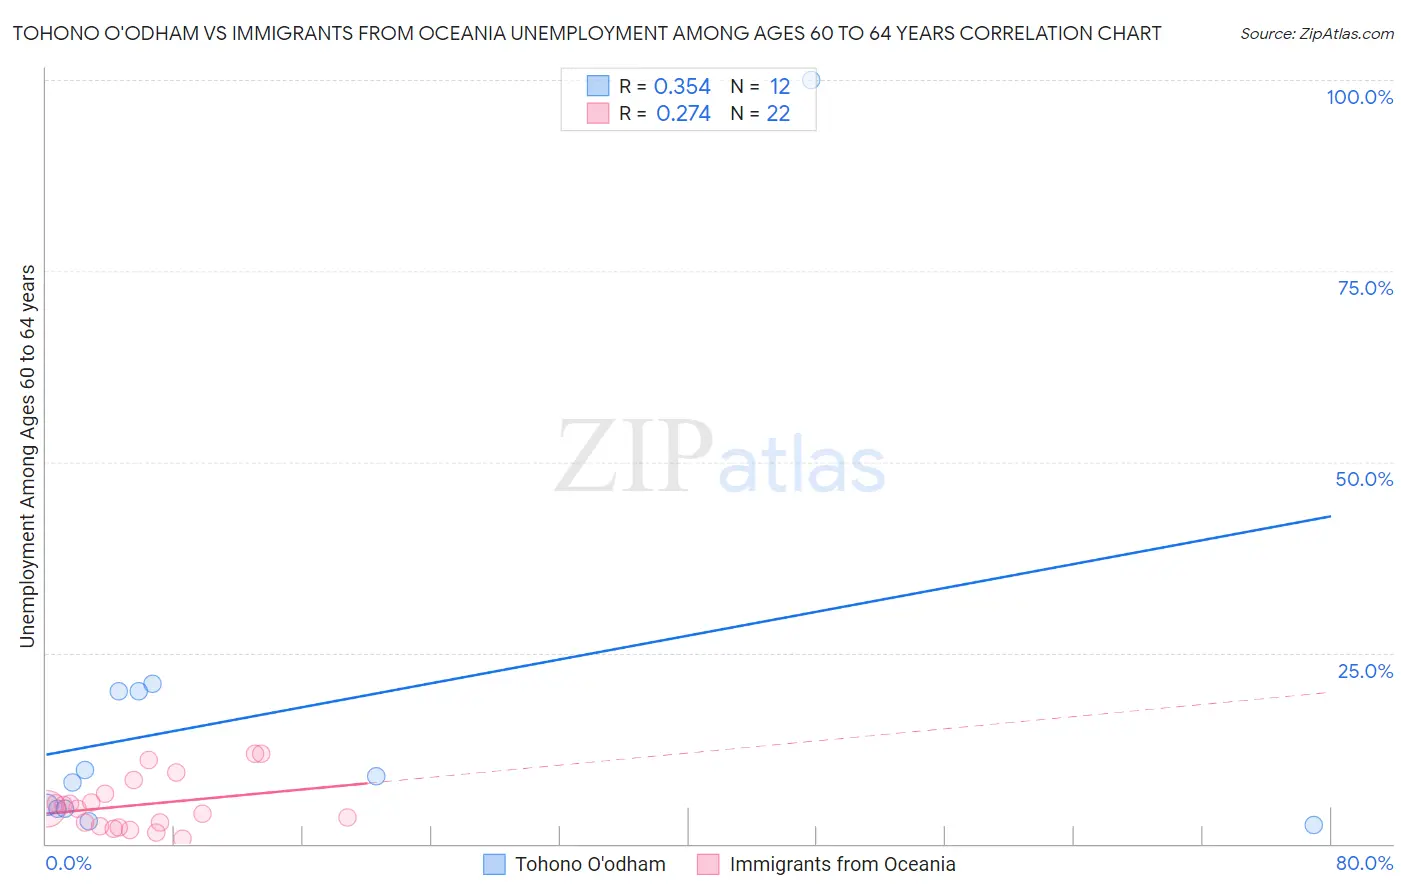
Tohono O'odham vs Immigrants from Oceania Unemployment Among Ages 60 to 64 years Correlation Chart

The statistical analysis conducted on geographies consisting of 57,527,437 people shows a mild positive correlation between the proportion of Tohono O'odham and unemployment rate among population between the ages 60 and 64 in the United States with a correlation coefficient (R) of 0.354 and weighted average of 5.0%. Similarly, the statistical analysis conducted on geographies consisting of 282,125,538 people shows a weak positive correlation between the proportion of Immigrants from Oceania and unemployment rate among population between the ages 60 and 64 in the United States with a correlation coefficient (R) of 0.274 and weighted average of 4.7%, a difference of 6.7%.
Tohono O'odham vs Immigrants from Oceania Unemployment Among Ages 60 to 64 years

Unemployment Among Ages 60 to 64 years Correlation Summary

MeasurementTohono O'odhamImmigrants from Oceania
Minimum2.5%0.70%
Maximum100.0%11.8%
Range97.5%11.1%
Mean17.3%5.1%
Median8.5%4.6%
Interquartile 25% (IQ1)4.6%2.3%
Interquartile 75% (IQ3)19.9%6.5%
Interquartile Range (IQR)15.4%4.2%
Standard Deviation (Sample)26.9%3.4%
Standard Deviation (Population)25.8%3.3%

Similar Demographics by Unemployment Among Ages 60 to 64 years

Demographics Similar to Tohono O'odham by Unemployment Among Ages 60 to 64 years

In terms of unemployment among ages 60 to 64 years, the demographic groups most similar to Tohono O'odham are Immigrants from Denmark (5.0%, a difference of 0.0%), African (5.0%, a difference of 0.030%), Immigrants from Belarus (5.0%, a difference of 0.10%), Nigerian (5.0%, a difference of 0.15%), and Immigrants from Chile (5.0%, a difference of 0.16%).
DemographicsRating | RankUnemployment Among Ages 60 to 64 years
Immigrants | Cameroon
8.5
/100
|
#224
Tragic
5.0%
Immigrants | Ireland
7.2
/100
|
#225
Tragic
5.0%
Immigrants | Chile
6.8
/100
|
#226
Tragic
5.0%
Nigerians
6.8
/100
|
#227
Tragic
5.0%
Immigrants | Belarus
6.4
/100
|
#228
Tragic
5.0%
Africans
5.9
/100
|
#229
Tragic
5.0%
Immigrants | Denmark
5.8
/100
|
#230
Tragic
5.0%
Tohono O'odham
5.7
/100
|
#231
Tragic
5.0%
Immigrants | Eastern Asia
4.7
/100
|
#232
Tragic
5.0%
Immigrants | Greece
4.6
/100
|
#233
Tragic
5.0%
Iranians
4.2
/100
|
#234
Tragic
5.0%
Delaware
3.6
/100
|
#235
Tragic
5.0%
Immigrants | Sierra Leone
3.1
/100
|
#236
Tragic
5.0%
Immigrants | Western Asia
3.0
/100
|
#237
Tragic
5.0%
Immigrants | Poland
3.0
/100
|
#238
Tragic
5.0%

Demographics Similar to Immigrants from Oceania by Unemployment Among Ages 60 to 64 years

In terms of unemployment among ages 60 to 64 years, the demographic groups most similar to Immigrants from Oceania are Thai (4.7%, a difference of 0.020%), Immigrants from Sri Lanka (4.7%, a difference of 0.020%), Immigrants from Jordan (4.7%, a difference of 0.040%), Immigrants from Bulgaria (4.7%, a difference of 0.11%), and Immigrants from Northern Africa (4.7%, a difference of 0.11%).
DemographicsRating | RankUnemployment Among Ages 60 to 64 years
Irish
99.2
/100
|
#79
Exceptional
4.7%
Icelanders
99.1
/100
|
#80
Exceptional
4.7%
Iroquois
99.1
/100
|
#81
Exceptional
4.7%
Okinawans
99.1
/100
|
#82
Exceptional
4.7%
Immigrants | Egypt
99.1
/100
|
#83
Exceptional
4.7%
Thais
98.9
/100
|
#84
Exceptional
4.7%
Immigrants | Sri Lanka
98.9
/100
|
#85
Exceptional
4.7%
Immigrants | Oceania
98.9
/100
|
#86
Exceptional
4.7%
Immigrants | Jordan
98.8
/100
|
#87
Exceptional
4.7%
Immigrants | Bulgaria
98.7
/100
|
#88
Exceptional
4.7%
Immigrants | Northern Africa
98.7
/100
|
#89
Exceptional
4.7%
Immigrants | Liberia
98.7
/100
|
#90
Exceptional
4.7%
Immigrants | Uganda
98.4
/100
|
#91
Exceptional
4.7%
Romanians
98.4
/100
|
#92
Exceptional
4.7%
Immigrants | Saudi Arabia
98.3
/100
|
#93
Exceptional
4.7%