Tohono O'odham vs Cherokee Unemployment Among Ages 16 to 19 years

COMPARE

Tohono O'odham
Race
Ancestry
AfghanAfricanAlaska NativeAlaskan AthabascanAlbanianAleutAlsatianAmericanApacheArabArapahoArgentineanArmenianAssyrian/Chaldean/SyriacAustralianAustrianBahamianBangladeshiBarbadianBasqueBelgianBelizeanBermudanBhutaneseBlackfeetBolivianBrazilianBritishBritish West IndianBulgarianBurmeseCajunCambodianCanadianCape VerdeanCarpatho RusynCelticCentral AmericanCentral American IndianCheyenneChickasawChileanChineseChippewaChoctawColombianColvilleComancheCosta RicanCreeCreekCroatianCrowCubanCypriotCzechCzechoslovakianDanishDelawareDominicanDutchDutch West IndianEastern EuropeanEcuadorianEgyptianEnglishEstonianEthiopianEuropeanFijianFilipinoFinnishFrenchFrench American IndianFrench CanadianGermanGerman RussianGhanaianGreekGuamanian/ChamorroGuatemalanGuyaneseHaitianHmongHonduranHopiHoumaHungarianIcelanderIndian (Asian)IndonesianInupiatIranianIraqiIrishIroquoisIsraeliItalianJamaicanJapaneseJordanianKenyanKiowaKoreanLaotianLatvianLebaneseLiberianLithuanianLumbeeLuxembourgerMacedonianMalaysianMalteseMarshalleseMenomineeMexicanMexican American IndianMongolianMoroccanNative HawaiianNavajoNepaleseNew ZealanderNicaraguanNigerianNorthern EuropeanNorwegianOkinawanOsageOttawaPaiutePakistaniPalestinianPanamanianParaguayanPennsylvania GermanPeruvianPimaPolishPortuguesePotawatomiPuebloPuerto RicanPuget Sound SalishRomanianRussianSalvadoranSamoanScandinavianScotch-IrishScottishSeminoleSenegaleseSerbianShoshoneSierra LeoneanSiouxSlavicSlovakSloveneSomaliSouth AfricanSouth AmericanSouth American IndianSoviet UnionSpaniardSpanishSpanish AmericanSpanish American IndianSri LankanSubsaharan AfricanSudaneseSwedishSwissSyrianTaiwaneseThaiTlingit-HaidaTohono O'OdhamTonganTrinidadian and TobagonianTsimshianTurkishU.S. Virgin IslanderUgandanUkrainianUruguayanUteVenezuelanVietnameseWelshWest IndianYakamaYaquiYugoslavianYumanYup'ikZimbabwean
Immigration
NonimmigrantsImmigrantsAfghanistanAfricaAlbaniaArgentinaArmeniaAsiaAustraliaAustriaBahamasBangladeshBarbadosBelarusBelgiumBelizeBoliviaBosnia and HerzegovinaBrazilBulgariaBurma/MyanmarCabo VerdeCambodiaCameroonCanadaCaribbeanCentral AmericaChileChinaColombiaCongoCosta RicaCroatiaCubaCzechoslovakiaDenmarkDominicaDominican RepublicEastern AfricaEastern AsiaEastern EuropeEcuadorEgyptEl SalvadorEnglandEritreaEthiopiaEuropeFijiFranceGermanyGhanaGreeceGrenadaGuatemalaGuyanaHaitiHondurasHong KongHungaryIndiaIndonesiaIranIraqIrelandIsraelItalyJamaicaJapanJordanKazakhstanKenyaKoreaKuwaitLaosLatin AmericaLatviaLebanonLiberiaLithuaniaMalaysiaMexicoMicronesiaMiddle AfricaMoldovaMoroccoNepalNetherlandsNicaraguaNigeriaNorth AmericaNorth MacedoniaNorthern AfricaNorthern EuropeNorwayOceaniaPakistanPanamaPeruPhilippinesPolandPortugalRomaniaRussiaSaudi ArabiaScotlandSenegalSerbiaSierra LeoneSingaporeSomaliaSouth AfricaSouth AmericaSouth Central AsiaSouth Eastern AsiaSouthern EuropeSpainSri LankaSt. Vincent and the GrenadinesSudanSwedenSwitzerlandSyriaTaiwanThailandTrinidad and TobagoTurkeyUgandaUkraineUruguayUzbekistanVenezuelaVietnamWest IndiesWestern AfricaWestern AsiaWestern EuropeYemenZaireZimbabweAzores
Cherokee
Race
Ancestry
AfghanAfricanAlaska NativeAlaskan AthabascanAlbanianAleutAlsatianAmericanApacheArabArapahoArgentineanArmenianAssyrian/Chaldean/SyriacAustralianAustrianBahamianBangladeshiBarbadianBasqueBelgianBelizeanBermudanBhutaneseBlackfeetBolivianBrazilianBritishBritish West IndianBulgarianBurmeseCajunCambodianCanadianCape VerdeanCarpatho RusynCelticCentral AmericanCentral American IndianCherokeeCheyenneChickasawChileanChineseChippewaChoctawColombianColvilleComancheCosta RicanCreeCreekCroatianCrowCubanCypriotCzechCzechoslovakianDanishDelawareDominicanDutchDutch West IndianEastern EuropeanEcuadorianEgyptianEnglishEstonianEthiopianEuropeanFijianFilipinoFinnishFrenchFrench American IndianFrench CanadianGermanGerman RussianGhanaianGreekGuamanian/ChamorroGuatemalanGuyaneseHaitianHmongHonduranHopiHoumaHungarianIcelanderIndian (Asian)IndonesianInupiatIranianIraqiIrishIroquoisIsraeliItalianJamaicanJapaneseJordanianKenyanKiowaKoreanLaotianLatvianLebaneseLiberianLithuanianLumbeeLuxembourgerMacedonianMalaysianMalteseMarshalleseMenomineeMexicanMexican American IndianMongolianMoroccanNative HawaiianNavajoNepaleseNew ZealanderNicaraguanNigerianNorthern EuropeanNorwegianOkinawanOsageOttawaPaiutePakistaniPalestinianPanamanianParaguayanPennsylvania GermanPeruvianPimaPolishPortuguesePotawatomiPuebloPuerto RicanPuget Sound SalishRomanianRussianSalvadoranSamoanScandinavianScotch-IrishScottishSeminoleSenegaleseSerbianShoshoneSierra LeoneanSiouxSlavicSlovakSloveneSomaliSouth AfricanSouth AmericanSouth American IndianSoviet UnionSpaniardSpanishSpanish AmericanSpanish American IndianSri LankanSubsaharan AfricanSudaneseSwedishSwissSyrianTaiwaneseThaiTlingit-HaidaTonganTrinidadian and TobagonianTsimshianTurkishU.S. Virgin IslanderUgandanUkrainianUruguayanUteVenezuelanVietnameseWelshWest IndianYakamaYaquiYugoslavianYumanYup'ikZimbabwean
Immigration
NonimmigrantsImmigrantsAfghanistanAfricaAlbaniaArgentinaArmeniaAsiaAustraliaAustriaBahamasBangladeshBarbadosBelarusBelgiumBelizeBoliviaBosnia and HerzegovinaBrazilBulgariaBurma/MyanmarCabo VerdeCambodiaCameroonCanadaCaribbeanCentral AmericaChileChinaColombiaCongoCosta RicaCroatiaCubaCzechoslovakiaDenmarkDominicaDominican RepublicEastern AfricaEastern AsiaEastern EuropeEcuadorEgyptEl SalvadorEnglandEritreaEthiopiaEuropeFijiFranceGermanyGhanaGreeceGrenadaGuatemalaGuyanaHaitiHondurasHong KongHungaryIndiaIndonesiaIranIraqIrelandIsraelItalyJamaicaJapanJordanKazakhstanKenyaKoreaKuwaitLaosLatin AmericaLatviaLebanonLiberiaLithuaniaMalaysiaMexicoMicronesiaMiddle AfricaMoldovaMoroccoNepalNetherlandsNicaraguaNigeriaNorth AmericaNorth MacedoniaNorthern AfricaNorthern EuropeNorwayOceaniaPakistanPanamaPeruPhilippinesPolandPortugalRomaniaRussiaSaudi ArabiaScotlandSenegalSerbiaSierra LeoneSingaporeSomaliaSouth AfricaSouth AmericaSouth Central AsiaSouth Eastern AsiaSouthern EuropeSpainSri LankaSt. Vincent and the GrenadinesSudanSwedenSwitzerlandSyriaTaiwanThailandTrinidad and TobagoTurkeyUgandaUkraineUruguayUzbekistanVenezuelaVietnamWest IndiesWestern AfricaWestern AsiaWestern EuropeYemenZaireZimbabweAzores
Unemployment Among Ages 16 to 19 years
Income
Poverty
Unemployment
Labor Participation
Family Structure
Vehicle Availability
Education Level
Disability

Unemployment Among Ages 16 to 19 years Comparison

Tohono O'odham

Cherokee

Tragic
Poor
22.1%
UNEMPLOYMENT AMONG AGES 16 TO 19 YEARS
0.0/ 100
METRIC RATING
316th/ 347
METRIC RANK
17.9%
UNEMPLOYMENT AMONG AGES 16 TO 19 YEARS
15.7/ 100
METRIC RATING
209th/ 347
METRIC RANK

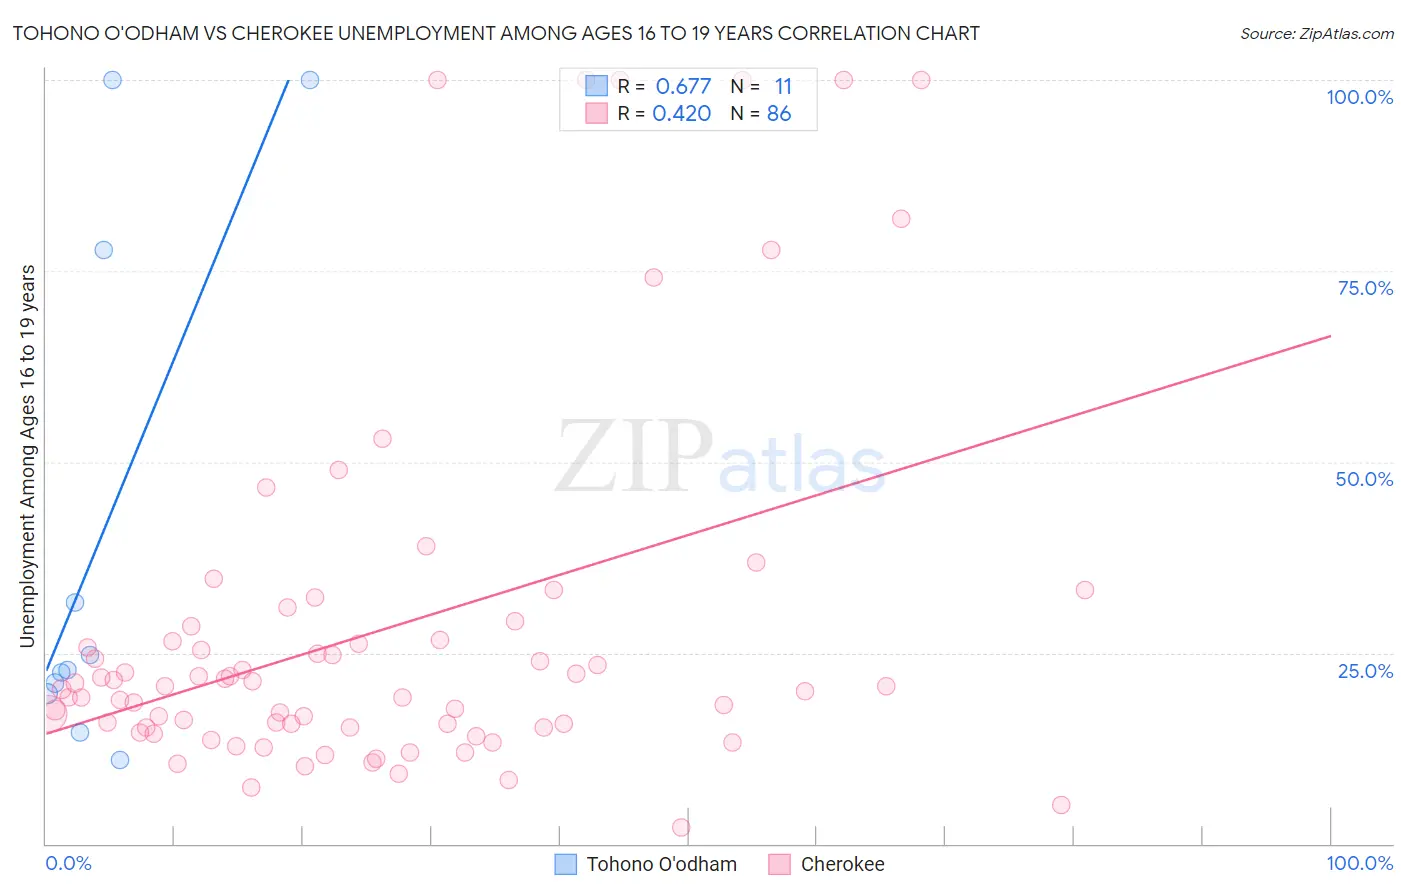
Tohono O'odham vs Cherokee Unemployment Among Ages 16 to 19 years Correlation Chart

The statistical analysis conducted on geographies consisting of 58,302,084 people shows a significant positive correlation between the proportion of Tohono O'odham and unemployment rate among population between the ages 16 and 19 in the United States with a correlation coefficient (R) of 0.677 and weighted average of 22.1%. Similarly, the statistical analysis conducted on geographies consisting of 455,329,369 people shows a moderate positive correlation between the proportion of Cherokee and unemployment rate among population between the ages 16 and 19 in the United States with a correlation coefficient (R) of 0.420 and weighted average of 17.9%, a difference of 23.1%.
Tohono O'odham vs Cherokee Unemployment Among Ages 16 to 19 years

Unemployment Among Ages 16 to 19 years Correlation Summary

MeasurementTohono O'odhamCherokee
Minimum10.9%2.2%
Maximum100.0%100.0%
Range89.1%97.8%
Mean40.5%28.0%
Median22.7%20.4%
Interquartile 25% (IQ1)19.6%15.2%
Interquartile 75% (IQ3)77.8%26.7%
Interquartile Range (IQR)58.2%11.5%
Standard Deviation (Sample)34.4%24.2%
Standard Deviation (Population)32.8%24.0%

Similar Demographics by Unemployment Among Ages 16 to 19 years

Demographics Similar to Tohono O'odham by Unemployment Among Ages 16 to 19 years

In terms of unemployment among ages 16 to 19 years, the demographic groups most similar to Tohono O'odham are Immigrants from Belize (22.2%, a difference of 0.45%), Immigrants from Dominica (21.9%, a difference of 0.54%), Immigrants from Jamaica (22.2%, a difference of 0.59%), Immigrants from West Indies (22.2%, a difference of 0.76%), and Cheyenne (22.3%, a difference of 0.98%).
DemographicsRating | RankUnemployment Among Ages 16 to 19 years
Natives/Alaskans
0.0
/100
|
#309
Tragic
21.5%
Vietnamese
0.0
/100
|
#310
Tragic
21.5%
Belizeans
0.0
/100
|
#311
Tragic
21.6%
Houma
0.0
/100
|
#312
Tragic
21.6%
Jamaicans
0.0
/100
|
#313
Tragic
21.7%
Alaska Natives
0.0
/100
|
#314
Tragic
21.8%
Immigrants | Dominica
0.0
/100
|
#315
Tragic
21.9%
Tohono O'odham
0.0
/100
|
#316
Tragic
22.1%
Immigrants | Belize
0.0
/100
|
#317
Tragic
22.2%
Immigrants | Jamaica
0.0
/100
|
#318
Tragic
22.2%
Immigrants | West Indies
0.0
/100
|
#319
Tragic
22.2%
Cheyenne
0.0
/100
|
#320
Tragic
22.3%
West Indians
0.0
/100
|
#321
Tragic
22.4%
Barbadians
0.0
/100
|
#322
Tragic
22.5%
Yakama
0.0
/100
|
#323
Tragic
22.5%

Demographics Similar to Cherokee by Unemployment Among Ages 16 to 19 years

In terms of unemployment among ages 16 to 19 years, the demographic groups most similar to Cherokee are Carpatho Rusyn (17.9%, a difference of 0.010%), Hawaiian (17.9%, a difference of 0.090%), Guamanian/Chamorro (17.9%, a difference of 0.12%), Argentinean (18.0%, a difference of 0.17%), and Chippewa (18.0%, a difference of 0.18%).
DemographicsRating | RankUnemployment Among Ages 16 to 19 years
Immigrants | Portugal
27.2
/100
|
#202
Fair
17.8%
Immigrants | Eastern Europe
23.6
/100
|
#203
Fair
17.8%
Immigrants | Nonimmigrants
20.9
/100
|
#204
Fair
17.9%
Assyrians/Chaldeans/Syriacs
20.8
/100
|
#205
Fair
17.9%
Immigrants | Southern Europe
18.9
/100
|
#206
Poor
17.9%
Liberians
18.6
/100
|
#207
Poor
17.9%
Hawaiians
16.8
/100
|
#208
Poor
17.9%
Cherokee
15.7
/100
|
#209
Poor
17.9%
Carpatho Rusyns
15.6
/100
|
#210
Poor
17.9%
Guamanians/Chamorros
14.5
/100
|
#211
Poor
17.9%
Argentineans
13.8
/100
|
#212
Poor
18.0%
Chippewa
13.7
/100
|
#213
Poor
18.0%
Immigrants | Morocco
13.5
/100
|
#214
Poor
18.0%
Immigrants | Syria
13.3
/100
|
#215
Poor
18.0%
Immigrants | Kazakhstan
13.0
/100
|
#216
Poor
18.0%