Spanish American Indian vs Turkish Female Unemployment
COMPARE
Spanish American Indian
Turkish
Female Unemployment
Female Unemployment Comparison
Spanish American Indians
Turks
6.2%
FEMALE UNEMPLOYMENT
0.0/ 100
METRIC RATING
305th/ 347
METRIC RANK
5.0%
FEMALE UNEMPLOYMENT
97.6/ 100
METRIC RATING
79th/ 347
METRIC RANK
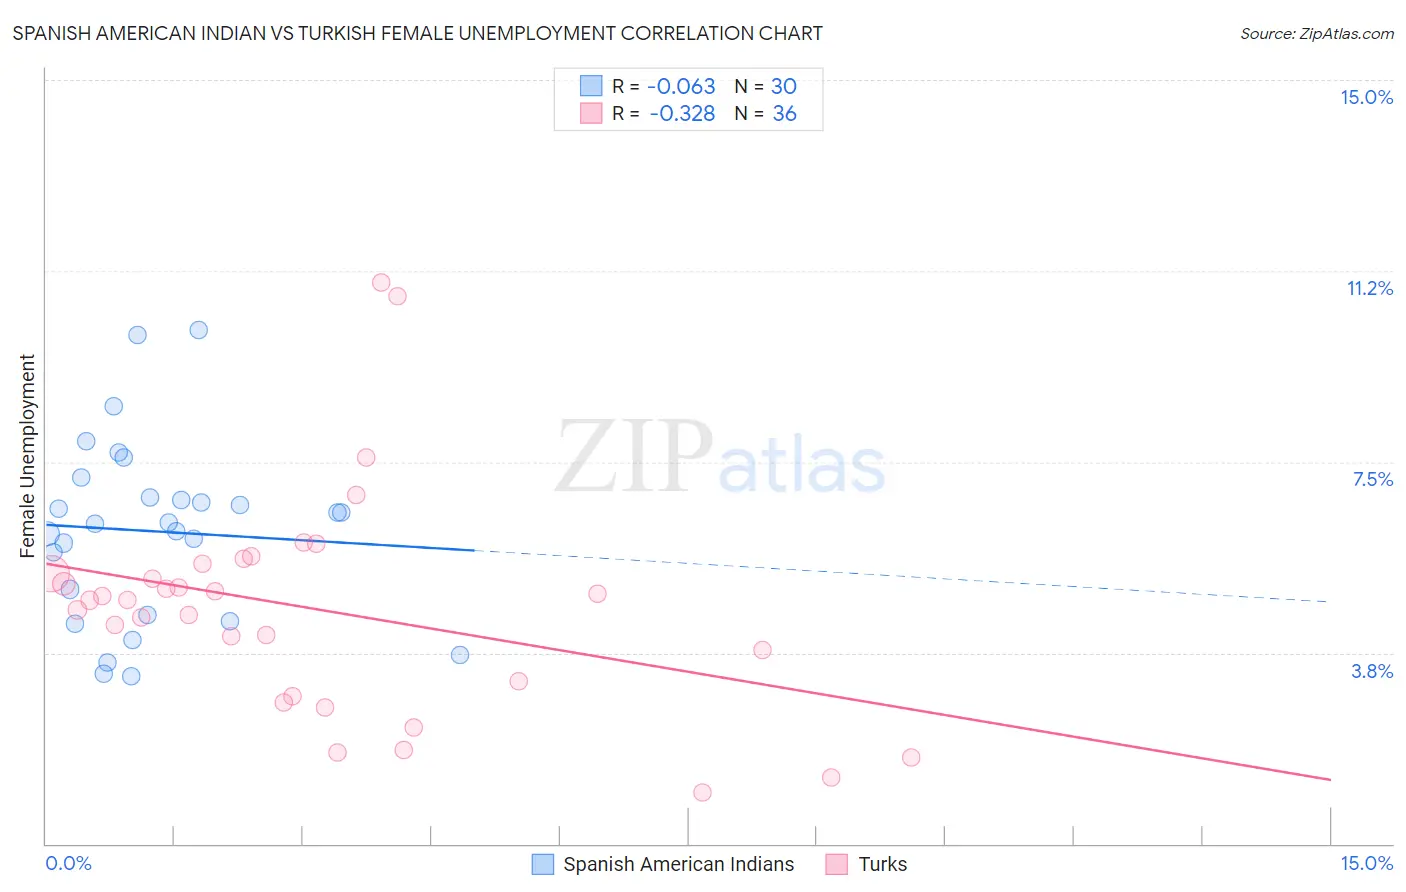
Spanish American Indian vs Turkish Female Unemployment Correlation Chart
The statistical analysis conducted on geographies consisting of 73,075,027 people shows a slight negative correlation between the proportion of Spanish American Indians and unemploymnet rate among females in the United States with a correlation coefficient (R) of -0.063 and weighted average of 6.2%. Similarly, the statistical analysis conducted on geographies consisting of 271,277,320 people shows a mild negative correlation between the proportion of Turks and unemploymnet rate among females in the United States with a correlation coefficient (R) of -0.328 and weighted average of 5.0%, a difference of 25.2%.
Female Unemployment Correlation Summary
| Measurement | Spanish American Indian | Turkish |
| Minimum | 3.3% | 1.0% |
| Maximum | 10.1% | 11.0% |
| Range | 6.8% | 10.0% |
| Mean | 6.1% | 4.6% |
| Median | 6.3% | 4.8% |
| Interquartile 25% (IQ1) | 4.5% | 3.0% |
| Interquartile 75% (IQ3) | 6.8% | 5.4% |
| Interquartile Range (IQR) | 2.3% | 2.3% |
| Standard Deviation (Sample) | 1.8% | 2.2% |
| Standard Deviation (Population) | 1.7% | 2.2% |
Similar Demographics by Female Unemployment
Demographics Similar to Spanish American Indians by Female Unemployment
In terms of female unemployment, the demographic groups most similar to Spanish American Indians are Immigrants from Jamaica (6.2%, a difference of 0.060%), Immigrants from Central America (6.2%, a difference of 0.16%), Shoshone (6.2%, a difference of 0.17%), Hispanic or Latino (6.2%, a difference of 0.23%), and Barbadian (6.2%, a difference of 0.42%).
| Demographics | Rating | Rank | Female Unemployment |
| Jamaicans | 0.0 /100 | #298 | Tragic 6.1% |
| Ute | 0.0 /100 | #299 | Tragic 6.1% |
| Immigrants | Haiti | 0.0 /100 | #300 | Tragic 6.1% |
| Immigrants | Barbados | 0.0 /100 | #301 | Tragic 6.2% |
| U.S. Virgin Islanders | 0.0 /100 | #302 | Tragic 6.2% |
| Barbadians | 0.0 /100 | #303 | Tragic 6.2% |
| Immigrants | Jamaica | 0.0 /100 | #304 | Tragic 6.2% |
| Spanish American Indians | 0.0 /100 | #305 | Tragic 6.2% |
| Immigrants | Central America | 0.0 /100 | #306 | Tragic 6.2% |
| Shoshone | 0.0 /100 | #307 | Tragic 6.2% |
| Hispanics or Latinos | 0.0 /100 | #308 | Tragic 6.2% |
| Ecuadorians | 0.0 /100 | #309 | Tragic 6.3% |
| Central American Indians | 0.0 /100 | #310 | Tragic 6.3% |
| Immigrants | Mexico | 0.0 /100 | #311 | Tragic 6.3% |
| Immigrants | Grenada | 0.0 /100 | #312 | Tragic 6.3% |
Demographics Similar to Turks by Female Unemployment
In terms of female unemployment, the demographic groups most similar to Turks are New Zealander (5.0%, a difference of 0.12%), Filipino (5.0%, a difference of 0.14%), Immigrants from Netherlands (5.0%, a difference of 0.18%), Mongolian (5.0%, a difference of 0.19%), and Immigrants from Australia (5.0%, a difference of 0.19%).
| Demographics | Rating | Rank | Female Unemployment |
| Immigrants | Northern Europe | 98.0 /100 | #72 | Exceptional 4.9% |
| Russians | 98.0 /100 | #73 | Exceptional 5.0% |
| Immigrants | Bolivia | 98.0 /100 | #74 | Exceptional 5.0% |
| Immigrants | Singapore | 98.0 /100 | #75 | Exceptional 5.0% |
| Immigrants | Venezuela | 97.9 /100 | #76 | Exceptional 5.0% |
| Mongolians | 97.8 /100 | #77 | Exceptional 5.0% |
| Immigrants | Netherlands | 97.8 /100 | #78 | Exceptional 5.0% |
| Turks | 97.6 /100 | #79 | Exceptional 5.0% |
| New Zealanders | 97.4 /100 | #80 | Exceptional 5.0% |
| Filipinos | 97.3 /100 | #81 | Exceptional 5.0% |
| Immigrants | Australia | 97.3 /100 | #82 | Exceptional 5.0% |
| Immigrants | Serbia | 97.2 /100 | #83 | Exceptional 5.0% |
| Canadians | 97.2 /100 | #84 | Exceptional 5.0% |
| Ukrainians | 97.1 /100 | #85 | Exceptional 5.0% |
| Bolivians | 97.1 /100 | #86 | Exceptional 5.0% |