Spanish American Indian vs Samoan Female Unemployment
COMPARE
Spanish American Indian
Samoan
Female Unemployment
Female Unemployment Comparison
Spanish American Indians
Samoans
6.2%
FEMALE UNEMPLOYMENT
0.0/ 100
METRIC RATING
305th/ 347
METRIC RANK
5.4%
FEMALE UNEMPLOYMENT
10.6/ 100
METRIC RATING
213th/ 347
METRIC RANK
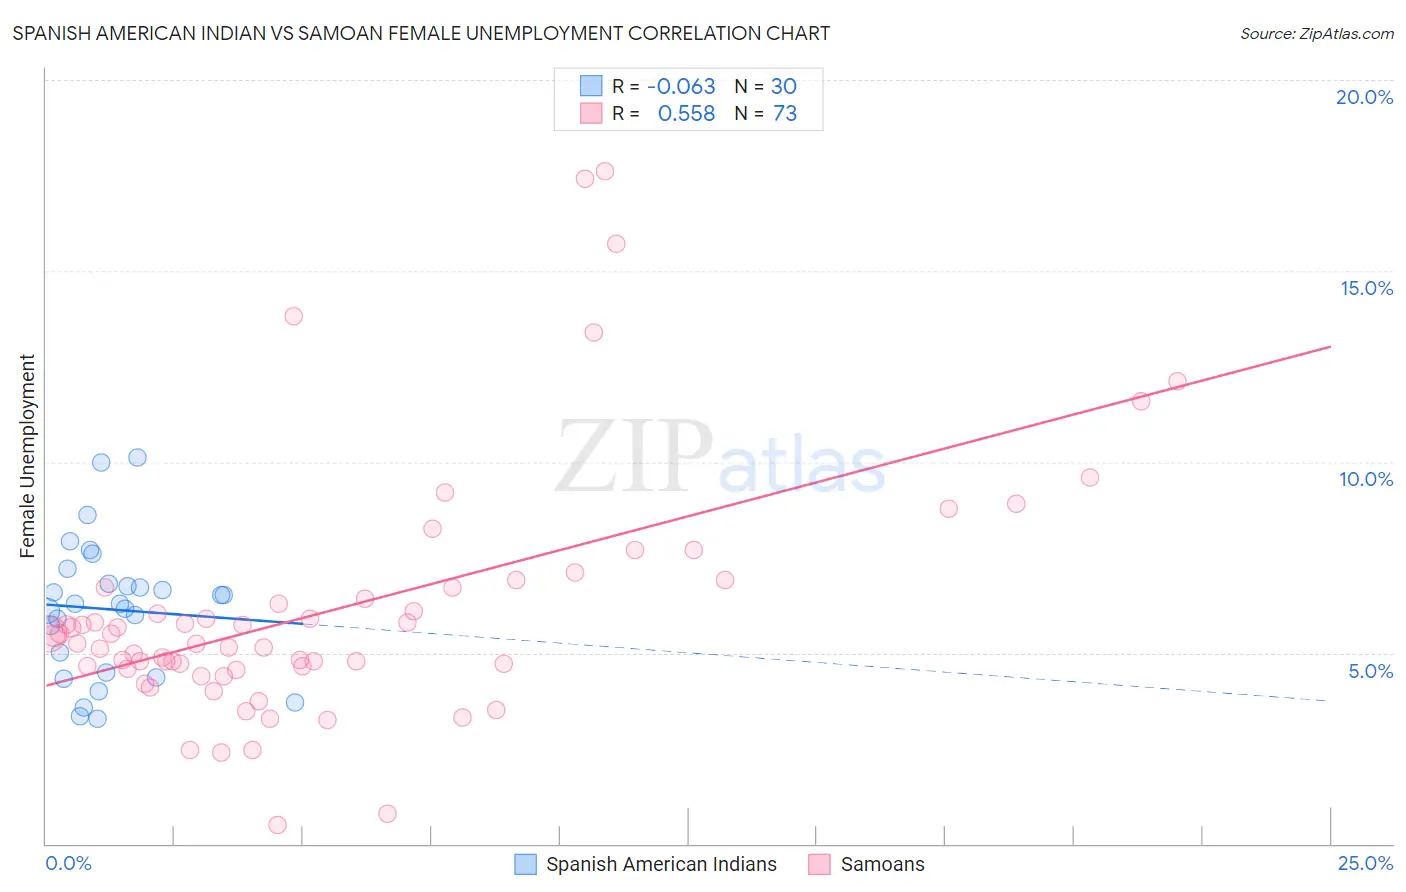
Spanish American Indian vs Samoan Female Unemployment Correlation Chart
The statistical analysis conducted on geographies consisting of 73,075,027 people shows a slight negative correlation between the proportion of Spanish American Indians and unemploymnet rate among females in the United States with a correlation coefficient (R) of -0.063 and weighted average of 6.2%. Similarly, the statistical analysis conducted on geographies consisting of 224,572,142 people shows a substantial positive correlation between the proportion of Samoans and unemploymnet rate among females in the United States with a correlation coefficient (R) of 0.558 and weighted average of 5.4%, a difference of 14.6%.
Female Unemployment Correlation Summary
| Measurement | Spanish American Indian | Samoan |
| Minimum | 3.3% | 0.50% |
| Maximum | 10.1% | 17.6% |
| Range | 6.8% | 17.1% |
| Mean | 6.1% | 6.1% |
| Median | 6.3% | 5.4% |
| Interquartile 25% (IQ1) | 4.5% | 4.6% |
| Interquartile 75% (IQ3) | 6.8% | 6.7% |
| Interquartile Range (IQR) | 2.3% | 2.1% |
| Standard Deviation (Sample) | 1.8% | 3.3% |
| Standard Deviation (Population) | 1.7% | 3.3% |
Similar Demographics by Female Unemployment
Demographics Similar to Spanish American Indians by Female Unemployment
In terms of female unemployment, the demographic groups most similar to Spanish American Indians are Immigrants from Jamaica (6.2%, a difference of 0.060%), Immigrants from Central America (6.2%, a difference of 0.16%), Shoshone (6.2%, a difference of 0.17%), Hispanic or Latino (6.2%, a difference of 0.23%), and Barbadian (6.2%, a difference of 0.42%).
| Demographics | Rating | Rank | Female Unemployment |
| Jamaicans | 0.0 /100 | #298 | Tragic 6.1% |
| Ute | 0.0 /100 | #299 | Tragic 6.1% |
| Immigrants | Haiti | 0.0 /100 | #300 | Tragic 6.1% |
| Immigrants | Barbados | 0.0 /100 | #301 | Tragic 6.2% |
| U.S. Virgin Islanders | 0.0 /100 | #302 | Tragic 6.2% |
| Barbadians | 0.0 /100 | #303 | Tragic 6.2% |
| Immigrants | Jamaica | 0.0 /100 | #304 | Tragic 6.2% |
| Spanish American Indians | 0.0 /100 | #305 | Tragic 6.2% |
| Immigrants | Central America | 0.0 /100 | #306 | Tragic 6.2% |
| Shoshone | 0.0 /100 | #307 | Tragic 6.2% |
| Hispanics or Latinos | 0.0 /100 | #308 | Tragic 6.2% |
| Ecuadorians | 0.0 /100 | #309 | Tragic 6.3% |
| Central American Indians | 0.0 /100 | #310 | Tragic 6.3% |
| Immigrants | Mexico | 0.0 /100 | #311 | Tragic 6.3% |
| Immigrants | Grenada | 0.0 /100 | #312 | Tragic 6.3% |
Demographics Similar to Samoans by Female Unemployment
In terms of female unemployment, the demographic groups most similar to Samoans are Seminole (5.4%, a difference of 0.050%), Immigrants from Nicaragua (5.4%, a difference of 0.070%), Comanche (5.4%, a difference of 0.090%), Uruguayan (5.4%, a difference of 0.12%), and Ottawa (5.4%, a difference of 0.14%).
| Demographics | Rating | Rank | Female Unemployment |
| Immigrants | Brazil | 18.8 /100 | #206 | Poor 5.4% |
| Creek | 15.4 /100 | #207 | Poor 5.4% |
| Immigrants | Costa Rica | 13.7 /100 | #208 | Poor 5.4% |
| Koreans | 13.4 /100 | #209 | Poor 5.4% |
| Choctaw | 12.3 /100 | #210 | Poor 5.4% |
| Ottawa | 11.6 /100 | #211 | Poor 5.4% |
| Uruguayans | 11.4 /100 | #212 | Poor 5.4% |
| Samoans | 10.6 /100 | #213 | Poor 5.4% |
| Seminole | 10.3 /100 | #214 | Poor 5.4% |
| Immigrants | Nicaragua | 10.2 /100 | #215 | Poor 5.4% |
| Comanche | 10.0 /100 | #216 | Poor 5.4% |
| Peruvians | 9.6 /100 | #217 | Tragic 5.4% |
| Bermudans | 9.0 /100 | #218 | Tragic 5.4% |
| South Americans | 8.6 /100 | #219 | Tragic 5.4% |
| Immigrants | Africa | 8.5 /100 | #220 | Tragic 5.4% |