Soviet Union vs French American Indian Unemployment Among Women with Children Under 6 years

COMPARE

Soviet Union
Race
Ancestry
AfghanAfricanAlaska NativeAlaskan AthabascanAlbanianAleutAlsatianAmericanApacheArabArapahoArgentineanArmenianAssyrian/Chaldean/SyriacAustralianAustrianBahamianBangladeshiBarbadianBasqueBelgianBelizeanBermudanBhutaneseBlackfeetBolivianBrazilianBritishBritish West IndianBulgarianBurmeseCajunCambodianCanadianCape VerdeanCarpatho RusynCelticCentral AmericanCentral American IndianCherokeeCheyenneChickasawChileanChineseChippewaChoctawColombianColvilleComancheCosta RicanCreeCreekCroatianCrowCubanCypriotCzechCzechoslovakianDanishDelawareDominicanDutchDutch West IndianEastern EuropeanEcuadorianEgyptianEnglishEstonianEthiopianEuropeanFijianFilipinoFinnishFrenchFrench CanadianGermanGerman RussianGhanaianGreekGuamanian/ChamorroGuatemalanGuyaneseHaitianHmongHonduranHopiHoumaHungarianIcelanderIndian (Asian)IndonesianInupiatIranianIraqiIrishIroquoisIsraeliItalianJamaicanJapaneseJordanianKenyanKiowaKoreanLaotianLatvianLebaneseLiberianLithuanianLumbeeLuxembourgerMacedonianMalaysianMalteseMarshalleseMenomineeMexicanMexican American IndianMongolianMoroccanNative HawaiianNavajoNepaleseNew ZealanderNicaraguanNigerianNorthern EuropeanNorwegianOkinawanOsageOttawaPaiutePakistaniPalestinianPanamanianParaguayanPennsylvania GermanPeruvianPimaPolishPortuguesePotawatomiPuebloPuerto RicanPuget Sound SalishRomanianRussianSalvadoranSamoanScandinavianScotch-IrishScottishSeminoleSenegaleseSerbianShoshoneSierra LeoneanSiouxSlavicSlovakSloveneSomaliSouth AfricanSouth AmericanSouth American IndianSoviet UnionSpaniardSpanishSpanish AmericanSpanish American IndianSri LankanSubsaharan AfricanSudaneseSwedishSwissSyrianTaiwaneseThaiTlingit-HaidaTohono O'OdhamTonganTrinidadian and TobagonianTsimshianTurkishU.S. Virgin IslanderUgandanUkrainianUruguayanUteVenezuelanVietnameseWelshWest IndianYakamaYaquiYugoslavianYumanYup'ikZimbabwean
Immigration
NonimmigrantsImmigrantsAfghanistanAfricaAlbaniaArgentinaArmeniaAsiaAustraliaAustriaBahamasBangladeshBarbadosBelarusBelgiumBelizeBoliviaBosnia and HerzegovinaBrazilBulgariaBurma/MyanmarCabo VerdeCambodiaCameroonCanadaCaribbeanCentral AmericaChileChinaColombiaCongoCosta RicaCroatiaCubaCzechoslovakiaDenmarkDominicaDominican RepublicEastern AfricaEastern AsiaEastern EuropeEcuadorEgyptEl SalvadorEnglandEritreaEthiopiaEuropeFijiFranceGermanyGhanaGreeceGrenadaGuatemalaGuyanaHaitiHondurasHong KongHungaryIndiaIndonesiaIranIraqIrelandIsraelItalyJamaicaJapanJordanKazakhstanKenyaKoreaKuwaitLaosLatin AmericaLatviaLebanonLiberiaLithuaniaMalaysiaMexicoMicronesiaMiddle AfricaMoldovaMoroccoNepalNetherlandsNicaraguaNigeriaNorth AmericaNorth MacedoniaNorthern AfricaNorthern EuropeNorwayOceaniaPakistanPanamaPeruPhilippinesPolandPortugalRomaniaRussiaSaudi ArabiaScotlandSenegalSerbiaSierra LeoneSingaporeSomaliaSouth AfricaSouth AmericaSouth Central AsiaSouth Eastern AsiaSouthern EuropeSpainSri LankaSt. Vincent and the GrenadinesSudanSwedenSwitzerlandSyriaTaiwanThailandTrinidad and TobagoTurkeyUgandaUkraineUruguayUzbekistanVenezuelaVietnamWest IndiesWestern AfricaWestern AsiaWestern EuropeYemenZaireZimbabweAzores
French American Indian
Race
Ancestry
AfghanAfricanAlaska NativeAlaskan AthabascanAlbanianAleutAlsatianAmericanApacheArabArapahoArgentineanArmenianAssyrian/Chaldean/SyriacAustralianAustrianBahamianBangladeshiBarbadianBasqueBelgianBelizeanBermudanBhutaneseBlackfeetBolivianBrazilianBritishBritish West IndianBulgarianBurmeseCajunCambodianCanadianCape VerdeanCarpatho RusynCelticCentral AmericanCentral American IndianCherokeeCheyenneChickasawChileanChineseChippewaChoctawColombianColvilleComancheCosta RicanCreeCreekCroatianCrowCubanCypriotCzechCzechoslovakianDanishDelawareDominicanDutchDutch West IndianEastern EuropeanEcuadorianEgyptianEnglishEstonianEthiopianEuropeanFijianFilipinoFinnishFrenchFrench American IndianFrench CanadianGermanGerman RussianGhanaianGreekGuamanian/ChamorroGuatemalanGuyaneseHaitianHmongHonduranHopiHoumaHungarianIcelanderIndian (Asian)IndonesianInupiatIranianIraqiIrishIroquoisIsraeliItalianJamaicanJapaneseJordanianKenyanKiowaKoreanLaotianLatvianLebaneseLiberianLithuanianLumbeeLuxembourgerMacedonianMalaysianMalteseMarshalleseMenomineeMexicanMexican American IndianMongolianMoroccanNative HawaiianNavajoNepaleseNew ZealanderNicaraguanNigerianNorthern EuropeanNorwegianOkinawanOsageOttawaPaiutePakistaniPalestinianPanamanianParaguayanPennsylvania GermanPeruvianPimaPolishPortuguesePotawatomiPuebloPuerto RicanPuget Sound SalishRomanianRussianSalvadoranSamoanScandinavianScotch-IrishScottishSeminoleSenegaleseSerbianShoshoneSierra LeoneanSiouxSlavicSlovakSloveneSomaliSouth AfricanSouth AmericanSouth American IndianSpaniardSpanishSpanish AmericanSpanish American IndianSri LankanSubsaharan AfricanSudaneseSwedishSwissSyrianTaiwaneseThaiTlingit-HaidaTohono O'OdhamTonganTrinidadian and TobagonianTsimshianTurkishU.S. Virgin IslanderUgandanUkrainianUruguayanUteVenezuelanVietnameseWelshWest IndianYakamaYaquiYugoslavianYumanYup'ikZimbabwean
Immigration
NonimmigrantsImmigrantsAfghanistanAfricaAlbaniaArgentinaArmeniaAsiaAustraliaAustriaBahamasBangladeshBarbadosBelarusBelgiumBelizeBoliviaBosnia and HerzegovinaBrazilBulgariaBurma/MyanmarCabo VerdeCambodiaCameroonCanadaCaribbeanCentral AmericaChileChinaColombiaCongoCosta RicaCroatiaCubaCzechoslovakiaDenmarkDominicaDominican RepublicEastern AfricaEastern AsiaEastern EuropeEcuadorEgyptEl SalvadorEnglandEritreaEthiopiaEuropeFijiFranceGermanyGhanaGreeceGrenadaGuatemalaGuyanaHaitiHondurasHong KongHungaryIndiaIndonesiaIranIraqIrelandIsraelItalyJamaicaJapanJordanKazakhstanKenyaKoreaKuwaitLaosLatin AmericaLatviaLebanonLiberiaLithuaniaMalaysiaMexicoMicronesiaMiddle AfricaMoldovaMoroccoNepalNetherlandsNicaraguaNigeriaNorth AmericaNorth MacedoniaNorthern AfricaNorthern EuropeNorwayOceaniaPakistanPanamaPeruPhilippinesPolandPortugalRomaniaRussiaSaudi ArabiaScotlandSenegalSerbiaSierra LeoneSingaporeSomaliaSouth AfricaSouth AmericaSouth Central AsiaSouth Eastern AsiaSouthern EuropeSpainSri LankaSt. Vincent and the GrenadinesSudanSwedenSwitzerlandSyriaTaiwanThailandTrinidad and TobagoTurkeyUgandaUkraineUruguayUzbekistanVenezuelaVietnamWest IndiesWestern AfricaWestern AsiaWestern EuropeYemenZaireZimbabweAzores
Unemployment Among Women with Children Under 6 years
Income
Poverty
Unemployment
Labor Participation
Family Structure
Vehicle Availability
Education Level
Disability

Unemployment Among Women with Children Under 6 years Comparison

Soviet Union

French American Indians

Exceptional
Tragic
6.5%
UNEMPLOYMENT AMONG WOMEN WITH CHILDREN UNDER 6 YEARS
100.0/ 100
METRIC RATING
25th/ 347
METRIC RANK
9.2%
UNEMPLOYMENT AMONG WOMEN WITH CHILDREN UNDER 6 YEARS
0.0/ 100
METRIC RATING
311th/ 347
METRIC RANK

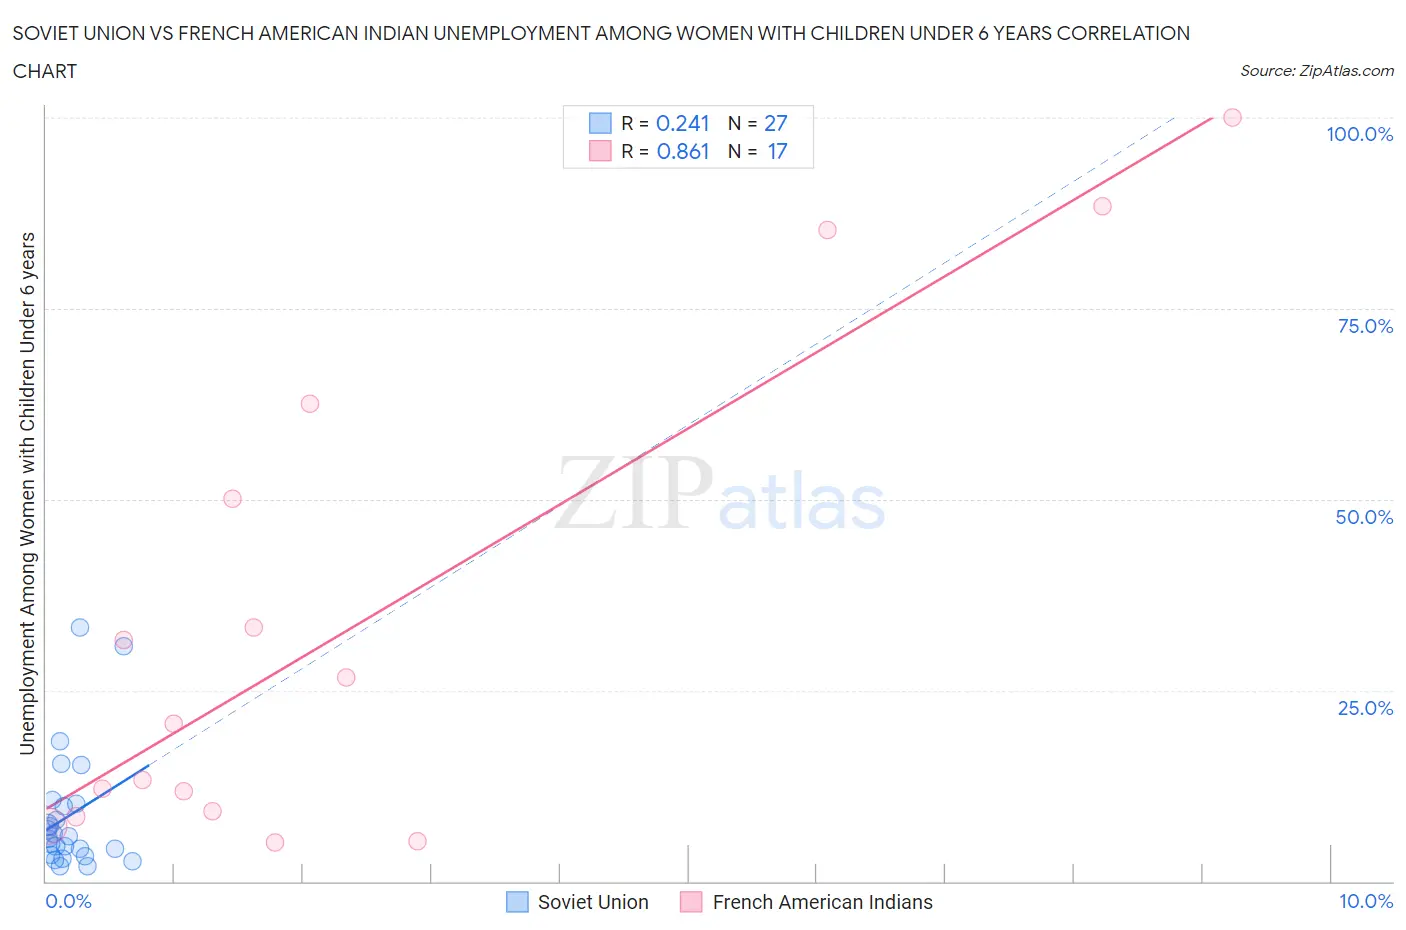
Soviet Union vs French American Indian Unemployment Among Women with Children Under 6 years Correlation Chart

The statistical analysis conducted on geographies consisting of 41,253,072 people shows a weak positive correlation between the proportion of Soviet Union and unemployment rate among women with children under the age of 6 in the United States with a correlation coefficient (R) of 0.241 and weighted average of 6.5%. Similarly, the statistical analysis conducted on geographies consisting of 112,876,255 people shows a very strong positive correlation between the proportion of French American Indians and unemployment rate among women with children under the age of 6 in the United States with a correlation coefficient (R) of 0.861 and weighted average of 9.2%, a difference of 40.9%.
Soviet Union vs French American Indian Unemployment Among Women with Children Under 6 years

Unemployment Among Women with Children Under 6 years Correlation Summary

MeasurementSoviet UnionFrench American Indian
Minimum2.0%5.0%
Maximum33.3%100.0%
Range31.3%95.0%
Mean8.6%33.6%
Median5.8%20.5%
Interquartile 25% (IQ1)3.5%8.8%
Interquartile 75% (IQ3)10.2%56.3%
Interquartile Range (IQR)6.7%47.5%
Standard Deviation (Sample)8.0%31.9%
Standard Deviation (Population)7.8%31.0%

Similar Demographics by Unemployment Among Women with Children Under 6 years

Demographics Similar to Soviet Union by Unemployment Among Women with Children Under 6 years

In terms of unemployment among women with children under 6 years, the demographic groups most similar to Soviet Union are Laotian (6.5%, a difference of 0.020%), Cypriot (6.5%, a difference of 0.080%), Bulgarian (6.5%, a difference of 0.16%), Immigrants from Japan (6.5%, a difference of 0.18%), and Immigrants from Israel (6.5%, a difference of 0.20%).
DemographicsRating | RankUnemployment Among Women with Children Under 6 years
Assyrians/Chaldeans/Syriacs
100.0
/100
|
#18
Exceptional
6.5%
Mongolians
100.0
/100
|
#19
Exceptional
6.5%
Ute
100.0
/100
|
#20
Exceptional
6.5%
Burmese
100.0
/100
|
#21
Exceptional
6.5%
Immigrants | Korea
100.0
/100
|
#22
Exceptional
6.5%
Bulgarians
100.0
/100
|
#23
Exceptional
6.5%
Laotians
100.0
/100
|
#24
Exceptional
6.5%
Soviet Union
100.0
/100
|
#25
Exceptional
6.5%
Cypriots
100.0
/100
|
#26
Exceptional
6.5%
Immigrants | Japan
100.0
/100
|
#27
Exceptional
6.5%
Immigrants | Israel
100.0
/100
|
#28
Exceptional
6.5%
Immigrants | Sweden
100.0
/100
|
#29
Exceptional
6.6%
Immigrants | Belarus
100.0
/100
|
#30
Exceptional
6.6%
Immigrants | Moldova
100.0
/100
|
#31
Exceptional
6.6%
Tsimshian
100.0
/100
|
#32
Exceptional
6.6%

Demographics Similar to French American Indians by Unemployment Among Women with Children Under 6 years

In terms of unemployment among women with children under 6 years, the demographic groups most similar to French American Indians are Immigrants from the Azores (9.2%, a difference of 0.14%), Cajun (9.2%, a difference of 0.28%), African (9.2%, a difference of 0.41%), American (9.3%, a difference of 0.58%), and Fijian (9.3%, a difference of 0.61%).
DemographicsRating | RankUnemployment Among Women with Children Under 6 years
Immigrants | Mexico
0.0
/100
|
#304
Tragic
9.1%
Alaskan Athabascans
0.0
/100
|
#305
Tragic
9.1%
Pueblo
0.0
/100
|
#306
Tragic
9.1%
Dominicans
0.0
/100
|
#307
Tragic
9.1%
Immigrants | Micronesia
0.0
/100
|
#308
Tragic
9.1%
Africans
0.0
/100
|
#309
Tragic
9.2%
Cajuns
0.0
/100
|
#310
Tragic
9.2%
French American Indians
0.0
/100
|
#311
Tragic
9.2%
Immigrants | Azores
0.0
/100
|
#312
Tragic
9.2%
Americans
0.0
/100
|
#313
Tragic
9.3%
Fijians
0.0
/100
|
#314
Tragic
9.3%
Cherokee
0.0
/100
|
#315
Tragic
9.3%
Houma
0.0
/100
|
#316
Tragic
9.4%
Dutch West Indians
0.0
/100
|
#317
Tragic
9.5%
Osage
0.0
/100
|
#318
Tragic
9.5%