Slovak vs Immigrants from Grenada Male Unemployment
COMPARE
Slovak
Immigrants from Grenada
Male Unemployment
Male Unemployment Comparison
Slovaks
Immigrants from Grenada
5.2%
MALE UNEMPLOYMENT
75.5/ 100
METRIC RATING
151st/ 347
METRIC RANK
7.6%
MALE UNEMPLOYMENT
0.0/ 100
METRIC RATING
323rd/ 347
METRIC RANK
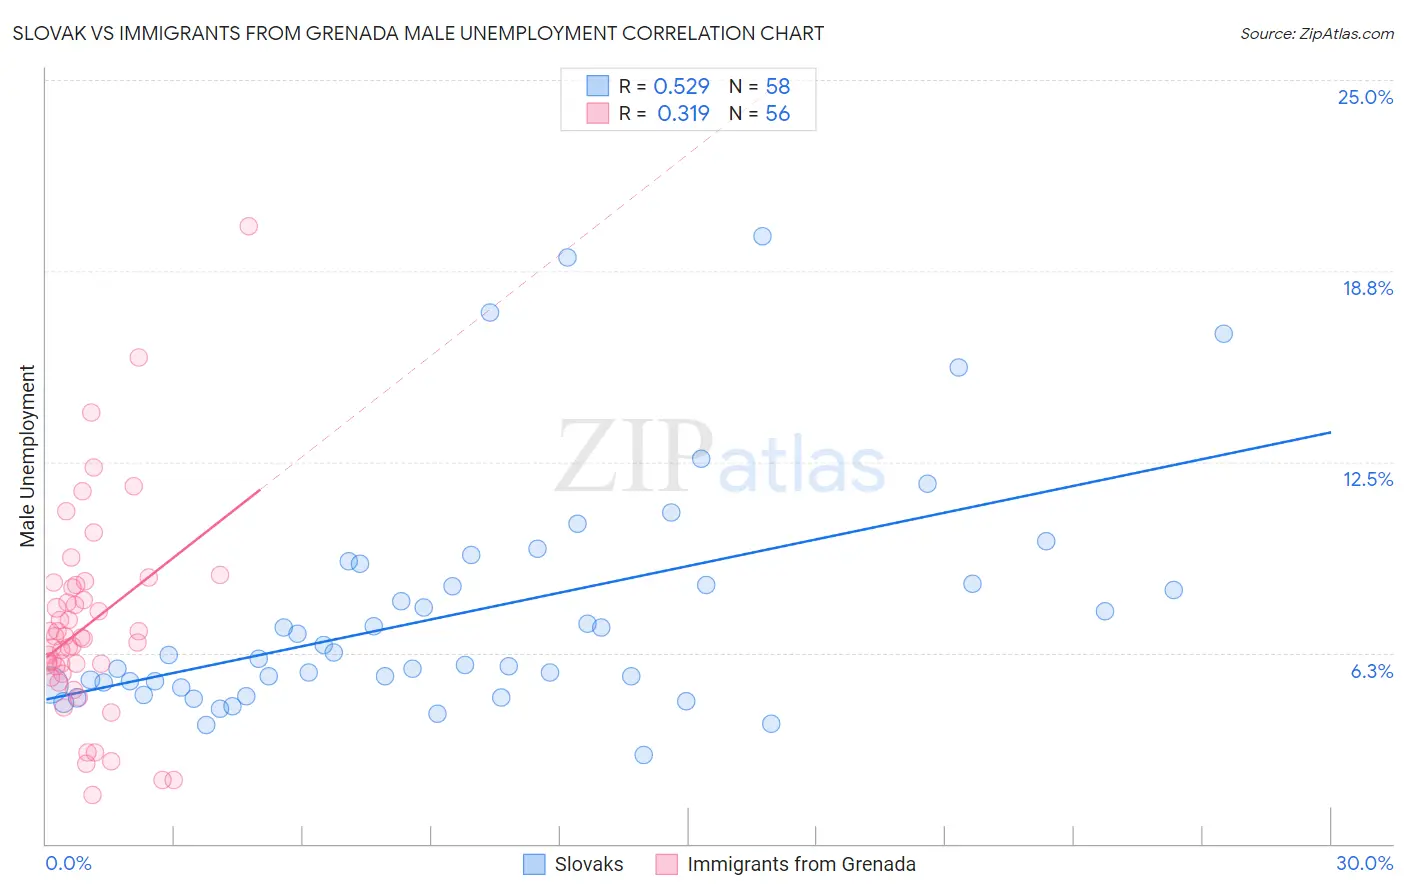
Slovak vs Immigrants from Grenada Male Unemployment Correlation Chart
The statistical analysis conducted on geographies consisting of 395,477,996 people shows a substantial positive correlation between the proportion of Slovaks and unemployment rate among males in the United States with a correlation coefficient (R) of 0.529 and weighted average of 5.2%. Similarly, the statistical analysis conducted on geographies consisting of 67,158,645 people shows a mild positive correlation between the proportion of Immigrants from Grenada and unemployment rate among males in the United States with a correlation coefficient (R) of 0.319 and weighted average of 7.6%, a difference of 45.0%.
Male Unemployment Correlation Summary
| Measurement | Slovak | Immigrants from Grenada |
| Minimum | 2.9% | 1.6% |
| Maximum | 19.9% | 20.2% |
| Range | 17.0% | 18.6% |
| Mean | 7.6% | 7.2% |
| Median | 6.1% | 6.7% |
| Interquartile 25% (IQ1) | 5.2% | 5.7% |
| Interquartile 75% (IQ3) | 8.5% | 8.4% |
| Interquartile Range (IQR) | 3.3% | 2.7% |
| Standard Deviation (Sample) | 3.8% | 3.3% |
| Standard Deviation (Population) | 3.8% | 3.3% |
Similar Demographics by Male Unemployment
Demographics Similar to Slovaks by Male Unemployment
In terms of male unemployment, the demographic groups most similar to Slovaks are Indian (Asian) (5.2%, a difference of 0.040%), Egyptian (5.2%, a difference of 0.050%), Immigrants from Italy (5.2%, a difference of 0.060%), Immigrants from Europe (5.2%, a difference of 0.060%), and Immigrants from Uruguay (5.2%, a difference of 0.13%).
| Demographics | Rating | Rank | Male Unemployment |
| Sri Lankans | 77.9 /100 | #144 | Good 5.2% |
| Macedonians | 77.7 /100 | #145 | Good 5.2% |
| Immigrants | Kenya | 77.6 /100 | #146 | Good 5.2% |
| Immigrants | Burma/Myanmar | 77.5 /100 | #147 | Good 5.2% |
| Immigrants | Italy | 76.3 /100 | #148 | Good 5.2% |
| Immigrants | Europe | 76.2 /100 | #149 | Good 5.2% |
| Indians (Asian) | 76.0 /100 | #150 | Good 5.2% |
| Slovaks | 75.5 /100 | #151 | Good 5.2% |
| Egyptians | 74.8 /100 | #152 | Good 5.2% |
| Immigrants | Uruguay | 73.9 /100 | #153 | Good 5.2% |
| Laotians | 73.8 /100 | #154 | Good 5.2% |
| Immigrants | Hungary | 73.4 /100 | #155 | Good 5.2% |
| Americans | 72.7 /100 | #156 | Good 5.2% |
| Immigrants | Northern Africa | 72.3 /100 | #157 | Good 5.2% |
| Immigrants | Indonesia | 71.5 /100 | #158 | Good 5.2% |
Demographics Similar to Immigrants from Grenada by Male Unemployment
In terms of male unemployment, the demographic groups most similar to Immigrants from Grenada are Dominican (7.6%, a difference of 0.27%), Shoshone (7.6%, a difference of 0.65%), Immigrants from Dominican Republic (7.6%, a difference of 0.75%), Immigrants from Cabo Verde (7.5%, a difference of 0.79%), and Immigrants from St. Vincent and the Grenadines (7.5%, a difference of 1.1%).
| Demographics | Rating | Rank | Male Unemployment |
| Immigrants | Guyana | 0.0 /100 | #316 | Tragic 7.1% |
| Guyanese | 0.0 /100 | #317 | Tragic 7.1% |
| Cape Verdeans | 0.0 /100 | #318 | Tragic 7.1% |
| British West Indians | 0.0 /100 | #319 | Tragic 7.3% |
| Colville | 0.0 /100 | #320 | Tragic 7.4% |
| Immigrants | St. Vincent and the Grenadines | 0.0 /100 | #321 | Tragic 7.5% |
| Immigrants | Cabo Verde | 0.0 /100 | #322 | Tragic 7.5% |
| Immigrants | Grenada | 0.0 /100 | #323 | Tragic 7.6% |
| Dominicans | 0.0 /100 | #324 | Tragic 7.6% |
| Shoshone | 0.0 /100 | #325 | Tragic 7.6% |
| Immigrants | Dominican Republic | 0.0 /100 | #326 | Tragic 7.6% |
| Paiute | 0.0 /100 | #327 | Tragic 7.7% |
| Natives/Alaskans | 0.0 /100 | #328 | Tragic 7.7% |
| Immigrants | Yemen | 0.0 /100 | #329 | Tragic 7.8% |
| Yakama | 0.0 /100 | #330 | Tragic 7.9% |