Serbian vs Immigrants from Bosnia and Herzegovina Male Unemployment
COMPARE
Serbian
Immigrants from Bosnia and Herzegovina
Male Unemployment
Male Unemployment Comparison
Serbians
Immigrants from Bosnia and Herzegovina
5.1%
MALE UNEMPLOYMENT
95.7/ 100
METRIC RATING
84th/ 347
METRIC RANK
4.9%
MALE UNEMPLOYMENT
99.4/ 100
METRIC RATING
38th/ 347
METRIC RANK
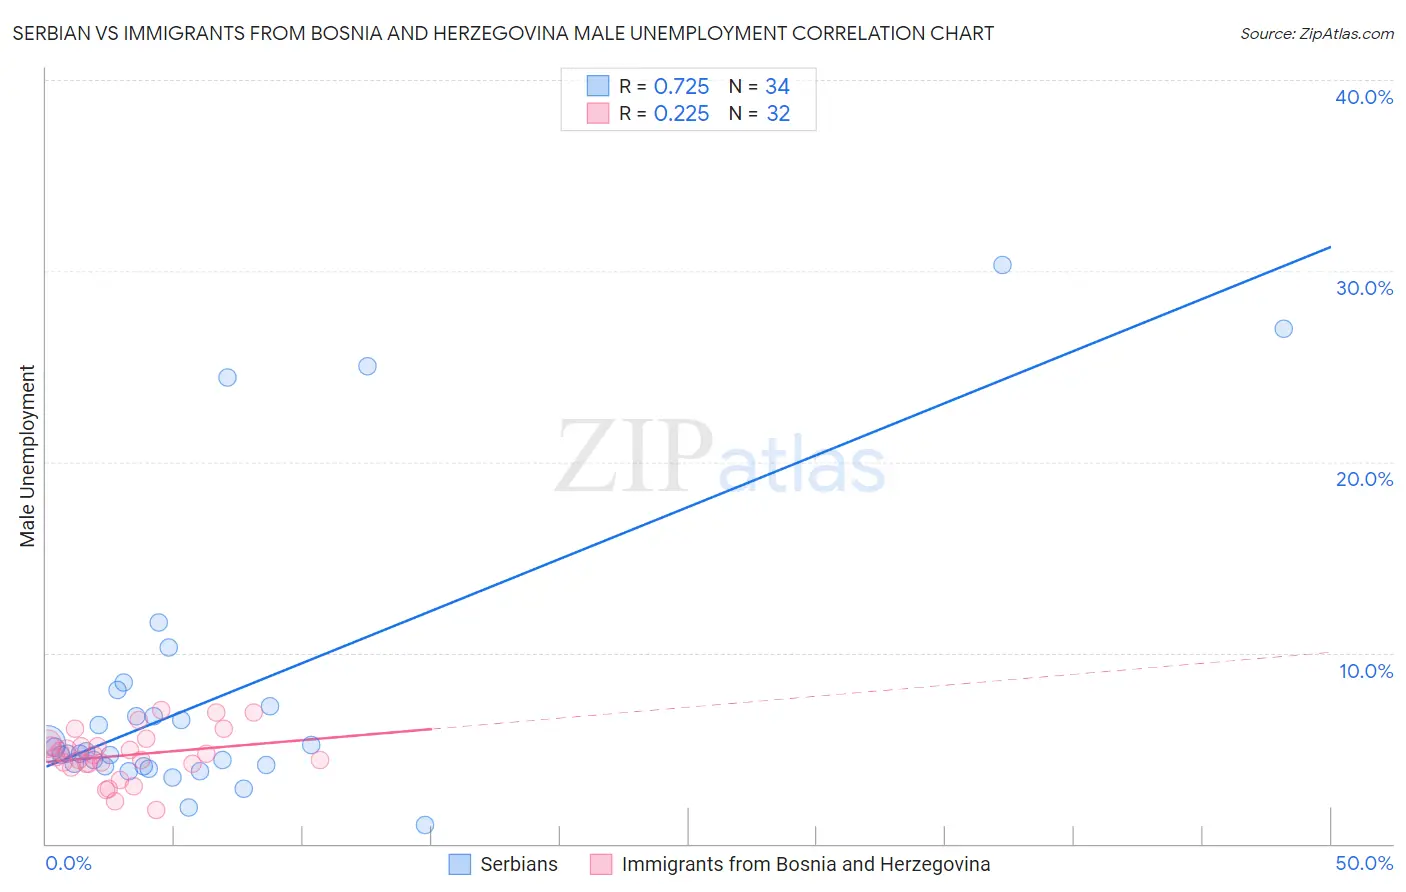
Serbian vs Immigrants from Bosnia and Herzegovina Male Unemployment Correlation Chart
The statistical analysis conducted on geographies consisting of 266,907,667 people shows a strong positive correlation between the proportion of Serbians and unemployment rate among males in the United States with a correlation coefficient (R) of 0.725 and weighted average of 5.1%. Similarly, the statistical analysis conducted on geographies consisting of 156,632,183 people shows a weak positive correlation between the proportion of Immigrants from Bosnia and Herzegovina and unemployment rate among males in the United States with a correlation coefficient (R) of 0.225 and weighted average of 4.9%, a difference of 3.0%.
Male Unemployment Correlation Summary
| Measurement | Serbian | Immigrants from Bosnia and Herzegovina |
| Minimum | 1.0% | 1.8% |
| Maximum | 30.3% | 7.0% |
| Range | 29.3% | 5.2% |
| Mean | 7.7% | 4.6% |
| Median | 4.8% | 4.6% |
| Interquartile 25% (IQ1) | 4.1% | 4.2% |
| Interquartile 75% (IQ3) | 7.2% | 5.2% |
| Interquartile Range (IQR) | 3.1% | 0.99% |
| Standard Deviation (Sample) | 7.4% | 1.3% |
| Standard Deviation (Population) | 7.3% | 1.3% |
Similar Demographics by Male Unemployment
Demographics Similar to Serbians by Male Unemployment
In terms of male unemployment, the demographic groups most similar to Serbians are Immigrants from North Macedonia (5.1%, a difference of 0.050%), Maltese (5.1%, a difference of 0.090%), Immigrants from Romania (5.1%, a difference of 0.11%), Immigrants from Eritrea (5.0%, a difference of 0.12%), and Chilean (5.0%, a difference of 0.17%).
| Demographics | Rating | Rank | Male Unemployment |
| Iranians | 96.4 /100 | #77 | Exceptional 5.0% |
| Immigrants | Northern Europe | 96.4 /100 | #78 | Exceptional 5.0% |
| South Africans | 96.4 /100 | #79 | Exceptional 5.0% |
| Argentineans | 96.2 /100 | #80 | Exceptional 5.0% |
| French | 96.2 /100 | #81 | Exceptional 5.0% |
| Chileans | 96.2 /100 | #82 | Exceptional 5.0% |
| Immigrants | Eritrea | 96.0 /100 | #83 | Exceptional 5.0% |
| Serbians | 95.7 /100 | #84 | Exceptional 5.1% |
| Immigrants | North Macedonia | 95.6 /100 | #85 | Exceptional 5.1% |
| Maltese | 95.5 /100 | #86 | Exceptional 5.1% |
| Immigrants | Romania | 95.4 /100 | #87 | Exceptional 5.1% |
| Immigrants | Sri Lanka | 94.9 /100 | #88 | Exceptional 5.1% |
| Immigrants | Australia | 94.7 /100 | #89 | Exceptional 5.1% |
| Okinawans | 94.7 /100 | #90 | Exceptional 5.1% |
| Immigrants | Turkey | 94.4 /100 | #91 | Exceptional 5.1% |
Demographics Similar to Immigrants from Bosnia and Herzegovina by Male Unemployment
In terms of male unemployment, the demographic groups most similar to Immigrants from Bosnia and Herzegovina are Scotch-Irish (4.9%, a difference of 0.020%), Burmese (4.9%, a difference of 0.070%), Northern European (4.9%, a difference of 0.15%), Immigrants from Singapore (4.9%, a difference of 0.23%), and Chinese (4.9%, a difference of 0.24%).
| Demographics | Rating | Rank | Male Unemployment |
| Sudanese | 99.8 /100 | #31 | Exceptional 4.8% |
| Immigrants | Nepal | 99.8 /100 | #32 | Exceptional 4.8% |
| Latvians | 99.7 /100 | #33 | Exceptional 4.8% |
| Welsh | 99.7 /100 | #34 | Exceptional 4.8% |
| Paraguayans | 99.5 /100 | #35 | Exceptional 4.9% |
| Immigrants | Singapore | 99.4 /100 | #36 | Exceptional 4.9% |
| Scotch-Irish | 99.4 /100 | #37 | Exceptional 4.9% |
| Immigrants | Bosnia and Herzegovina | 99.4 /100 | #38 | Exceptional 4.9% |
| Burmese | 99.3 /100 | #39 | Exceptional 4.9% |
| Northern Europeans | 99.3 /100 | #40 | Exceptional 4.9% |
| Chinese | 99.3 /100 | #41 | Exceptional 4.9% |
| Immigrants | Belgium | 99.2 /100 | #42 | Exceptional 4.9% |
| Immigrants | Japan | 99.2 /100 | #43 | Exceptional 4.9% |
| Immigrants | Korea | 99.1 /100 | #44 | Exceptional 4.9% |
| Immigrants | Zimbabwe | 99.0 /100 | #45 | Exceptional 4.9% |