Scottish vs Iroquois Unemployment Among Ages 16 to 19 years
COMPARE
Scottish
Iroquois
Unemployment Among Ages 16 to 19 years
Unemployment Among Ages 16 to 19 years Comparison
Scottish
Iroquois
16.2%
UNEMPLOYMENT AMONG AGES 16 TO 19 YEARS
99.8/ 100
METRIC RATING
35th/ 347
METRIC RANK
17.6%
UNEMPLOYMENT AMONG AGES 16 TO 19 YEARS
43.4/ 100
METRIC RATING
185th/ 347
METRIC RANK
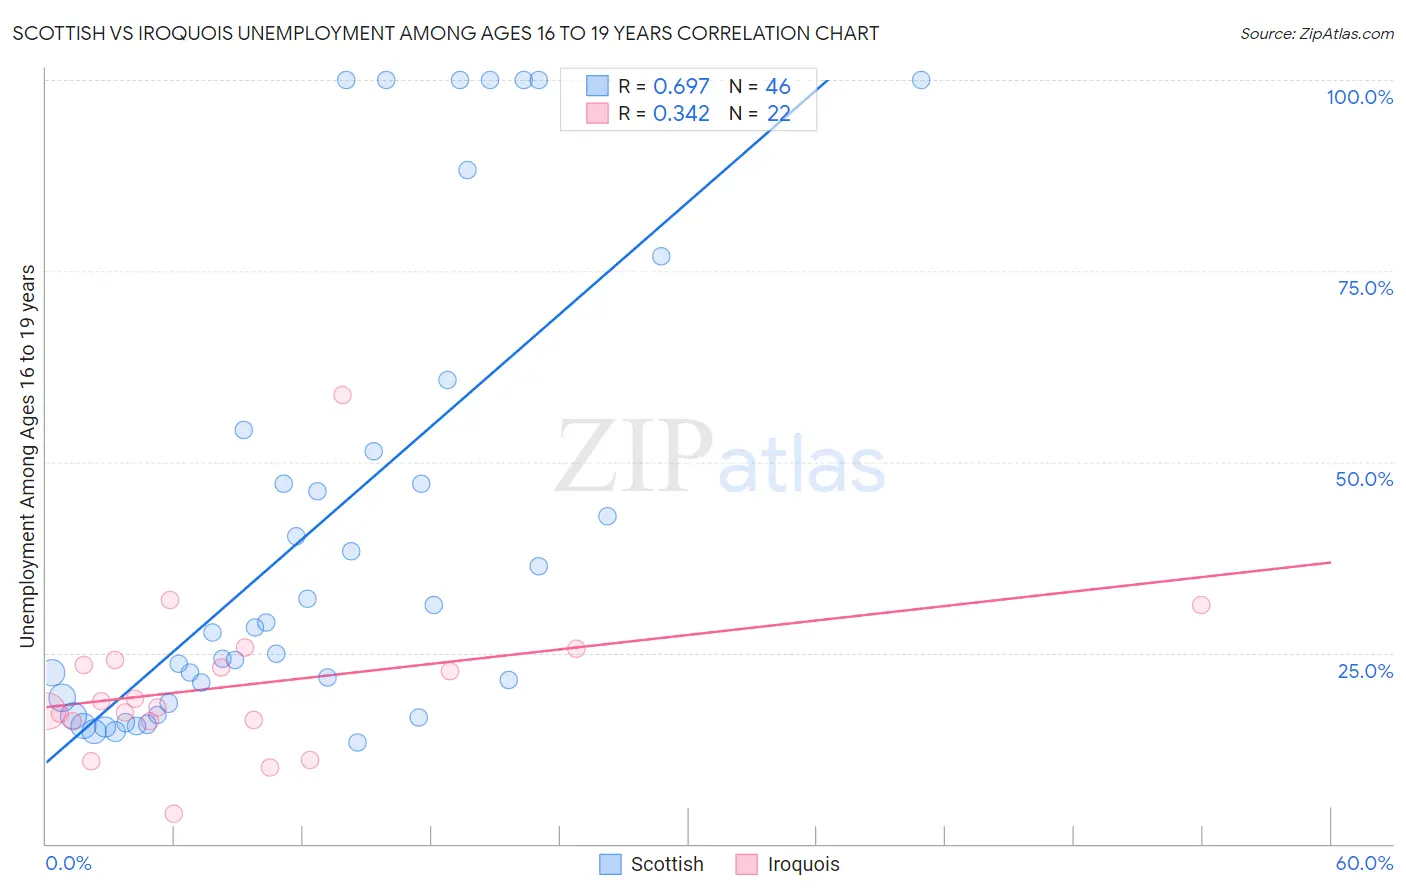
Scottish vs Iroquois Unemployment Among Ages 16 to 19 years Correlation Chart
The statistical analysis conducted on geographies consisting of 504,483,132 people shows a significant positive correlation between the proportion of Scottish and unemployment rate among population between the ages 16 and 19 in the United States with a correlation coefficient (R) of 0.697 and weighted average of 16.2%. Similarly, the statistical analysis conducted on geographies consisting of 200,302,978 people shows a mild positive correlation between the proportion of Iroquois and unemployment rate among population between the ages 16 and 19 in the United States with a correlation coefficient (R) of 0.342 and weighted average of 17.6%, a difference of 8.6%.
Unemployment Among Ages 16 to 19 years Correlation Summary
| Measurement | Scottish | Iroquois |
| Minimum | 13.2% | 4.0% |
| Maximum | 100.0% | 58.8% |
| Range | 86.8% | 54.8% |
| Mean | 41.1% | 20.8% |
| Median | 27.9% | 18.2% |
| Interquartile 25% (IQ1) | 18.4% | 16.1% |
| Interquartile 75% (IQ3) | 51.4% | 24.0% |
| Interquartile Range (IQR) | 33.0% | 7.9% |
| Standard Deviation (Sample) | 30.0% | 10.8% |
| Standard Deviation (Population) | 29.7% | 10.6% |
Similar Demographics by Unemployment Among Ages 16 to 19 years
Demographics Similar to Scottish by Unemployment Among Ages 16 to 19 years
In terms of unemployment among ages 16 to 19 years, the demographic groups most similar to Scottish are Immigrants from South Central Asia (16.2%, a difference of 0.010%), Immigrants from Congo (16.3%, a difference of 0.12%), Bulgarian (16.3%, a difference of 0.13%), Pennsylvania German (16.2%, a difference of 0.15%), and Immigrants from Kenya (16.2%, a difference of 0.18%).
| Demographics | Rating | Rank | Unemployment Among Ages 16 to 19 years |
| Jordanians | 99.9 /100 | #28 | Exceptional 16.0% |
| Chinese | 99.9 /100 | #29 | Exceptional 16.0% |
| Kenyans | 99.9 /100 | #30 | Exceptional 16.1% |
| English | 99.9 /100 | #31 | Exceptional 16.1% |
| Europeans | 99.9 /100 | #32 | Exceptional 16.1% |
| Immigrants | Kenya | 99.9 /100 | #33 | Exceptional 16.2% |
| Pennsylvania Germans | 99.9 /100 | #34 | Exceptional 16.2% |
| Scottish | 99.8 /100 | #35 | Exceptional 16.2% |
| Immigrants | South Central Asia | 99.8 /100 | #36 | Exceptional 16.2% |
| Immigrants | Congo | 99.8 /100 | #37 | Exceptional 16.3% |
| Bulgarians | 99.8 /100 | #38 | Exceptional 16.3% |
| Croatians | 99.8 /100 | #39 | Exceptional 16.3% |
| Hmong | 99.8 /100 | #40 | Exceptional 16.3% |
| Immigrants | Nepal | 99.8 /100 | #41 | Exceptional 16.3% |
| Fijians | 99.8 /100 | #42 | Exceptional 16.3% |
Demographics Similar to Iroquois by Unemployment Among Ages 16 to 19 years
In terms of unemployment among ages 16 to 19 years, the demographic groups most similar to Iroquois are Japanese (17.6%, a difference of 0.010%), Eastern European (17.6%, a difference of 0.040%), Immigrants from Uruguay (17.6%, a difference of 0.050%), Immigrants from Micronesia (17.6%, a difference of 0.050%), and Immigrants from Nicaragua (17.6%, a difference of 0.060%).
| Demographics | Rating | Rank | Unemployment Among Ages 16 to 19 years |
| Celtics | 48.7 /100 | #178 | Average 17.6% |
| Americans | 47.4 /100 | #179 | Average 17.6% |
| Spaniards | 47.1 /100 | #180 | Average 17.6% |
| Immigrants | Turkey | 45.6 /100 | #181 | Average 17.6% |
| Russians | 45.2 /100 | #182 | Average 17.6% |
| Immigrants | Uruguay | 44.6 /100 | #183 | Average 17.6% |
| Eastern Europeans | 44.3 /100 | #184 | Average 17.6% |
| Iroquois | 43.4 /100 | #185 | Average 17.6% |
| Japanese | 43.2 /100 | #186 | Average 17.6% |
| Immigrants | Micronesia | 42.4 /100 | #187 | Average 17.6% |
| Immigrants | Nicaragua | 42.2 /100 | #188 | Average 17.6% |
| Immigrants | Europe | 41.8 /100 | #189 | Average 17.6% |
| Marshallese | 41.7 /100 | #190 | Average 17.6% |
| Immigrants | Costa Rica | 41.3 /100 | #191 | Average 17.6% |
| Immigrants | Philippines | 40.7 /100 | #192 | Average 17.7% |