Immigrants from Bangladesh vs Iroquois Unemployment Among Ages 16 to 19 years

COMPARE

Immigrants from Bangladesh
Race
Ancestry
AfghanAfricanAlaska NativeAlaskan AthabascanAlbanianAleutAlsatianAmericanApacheArabArapahoArgentineanArmenianAssyrian/Chaldean/SyriacAustralianAustrianBahamianBangladeshiBarbadianBasqueBelgianBelizeanBermudanBhutaneseBlackfeetBolivianBrazilianBritishBritish West IndianBulgarianBurmeseCajunCambodianCanadianCape VerdeanCarpatho RusynCelticCentral AmericanCentral American IndianCherokeeCheyenneChickasawChileanChineseChippewaChoctawColombianColvilleComancheCosta RicanCreeCreekCroatianCrowCubanCypriotCzechCzechoslovakianDanishDelawareDominicanDutchDutch West IndianEastern EuropeanEcuadorianEgyptianEnglishEstonianEthiopianEuropeanFijianFilipinoFinnishFrenchFrench American IndianFrench CanadianGermanGerman RussianGhanaianGreekGuamanian/ChamorroGuatemalanGuyaneseHaitianHmongHonduranHopiHoumaHungarianIcelanderIndian (Asian)IndonesianInupiatIranianIraqiIrishIsraeliItalianJamaicanJapaneseJordanianKenyanKiowaKoreanLaotianLatvianLebaneseLiberianLithuanianLumbeeLuxembourgerMacedonianMalaysianMalteseMarshalleseMenomineeMexicanMexican American IndianMongolianMoroccanNative HawaiianNavajoNepaleseNew ZealanderNicaraguanNigerianNorthern EuropeanNorwegianOkinawanOsageOttawaPaiutePakistaniPalestinianPanamanianParaguayanPennsylvania GermanPeruvianPimaPolishPortuguesePotawatomiPuebloPuerto RicanPuget Sound SalishRomanianRussianSalvadoranSamoanScandinavianScotch-IrishScottishSeminoleSenegaleseSerbianShoshoneSierra LeoneanSiouxSlavicSlovakSloveneSomaliSouth AfricanSouth AmericanSouth American IndianSoviet UnionSpaniardSpanishSpanish AmericanSpanish American IndianSri LankanSubsaharan AfricanSudaneseSwedishSwissSyrianTaiwaneseThaiTlingit-HaidaTohono O'OdhamTonganTrinidadian and TobagonianTsimshianTurkishU.S. Virgin IslanderUgandanUkrainianUruguayanUteVenezuelanVietnameseWelshWest IndianYakamaYaquiYugoslavianYumanYup'ikZimbabwean
Immigration
NonimmigrantsImmigrantsAfghanistanAfricaAlbaniaArgentinaArmeniaAsiaAustraliaAustriaBahamasBangladeshBarbadosBelarusBelgiumBelizeBoliviaBosnia and HerzegovinaBrazilBulgariaBurma/MyanmarCabo VerdeCambodiaCameroonCanadaCaribbeanCentral AmericaChileChinaColombiaCongoCosta RicaCroatiaCubaCzechoslovakiaDenmarkDominicaDominican RepublicEastern AfricaEastern AsiaEastern EuropeEcuadorEgyptEl SalvadorEnglandEritreaEthiopiaEuropeFijiFranceGermanyGhanaGreeceGrenadaGuatemalaGuyanaHaitiHondurasHong KongHungaryIndiaIndonesiaIranIraqIrelandIsraelItalyJamaicaJapanJordanKazakhstanKenyaKoreaKuwaitLaosLatin AmericaLatviaLebanonLiberiaLithuaniaMalaysiaMexicoMicronesiaMiddle AfricaMoldovaMoroccoNepalNetherlandsNicaraguaNigeriaNorth AmericaNorth MacedoniaNorthern AfricaNorthern EuropeNorwayOceaniaPakistanPanamaPeruPhilippinesPolandPortugalRomaniaRussiaSaudi ArabiaScotlandSenegalSerbiaSierra LeoneSingaporeSomaliaSouth AfricaSouth AmericaSouth Central AsiaSouth Eastern AsiaSouthern EuropeSpainSri LankaSt. Vincent and the GrenadinesSudanSwedenSwitzerlandSyriaTaiwanThailandTrinidad and TobagoTurkeyUgandaUkraineUruguayUzbekistanVenezuelaVietnamWest IndiesWestern AfricaWestern AsiaWestern EuropeYemenZaireZimbabweAzores
Iroquois
Race
Ancestry
AfghanAfricanAlaska NativeAlaskan AthabascanAlbanianAleutAlsatianAmericanApacheArabArapahoArgentineanArmenianAssyrian/Chaldean/SyriacAustralianAustrianBahamianBangladeshiBarbadianBasqueBelgianBelizeanBermudanBhutaneseBlackfeetBolivianBrazilianBritishBritish West IndianBulgarianBurmeseCajunCambodianCanadianCape VerdeanCarpatho RusynCelticCentral AmericanCentral American IndianCherokeeCheyenneChickasawChileanChineseChippewaChoctawColombianColvilleComancheCosta RicanCreeCreekCroatianCrowCubanCypriotCzechCzechoslovakianDanishDelawareDominicanDutchDutch West IndianEastern EuropeanEcuadorianEgyptianEnglishEstonianEthiopianEuropeanFijianFilipinoFinnishFrenchFrench American IndianFrench CanadianGermanGerman RussianGhanaianGreekGuamanian/ChamorroGuatemalanGuyaneseHaitianHmongHonduranHopiHoumaHungarianIcelanderIndian (Asian)IndonesianInupiatIranianIraqiIrishIroquoisIsraeliItalianJamaicanJapaneseJordanianKenyanKiowaKoreanLaotianLatvianLebaneseLiberianLithuanianLumbeeLuxembourgerMacedonianMalaysianMalteseMarshalleseMenomineeMexicanMexican American IndianMongolianMoroccanNative HawaiianNavajoNepaleseNew ZealanderNicaraguanNigerianNorthern EuropeanNorwegianOkinawanOsageOttawaPaiutePakistaniPalestinianPanamanianParaguayanPennsylvania GermanPeruvianPimaPolishPortuguesePotawatomiPuebloPuerto RicanPuget Sound SalishRomanianRussianSalvadoranSamoanScandinavianScotch-IrishScottishSeminoleSenegaleseSerbianShoshoneSierra LeoneanSiouxSlavicSlovakSloveneSomaliSouth AfricanSouth AmericanSouth American IndianSoviet UnionSpaniardSpanishSpanish AmericanSpanish American IndianSri LankanSubsaharan AfricanSudaneseSwedishSwissSyrianTaiwaneseThaiTlingit-HaidaTohono O'OdhamTonganTrinidadian and TobagonianTsimshianTurkishU.S. Virgin IslanderUgandanUkrainianUruguayanUteVenezuelanVietnameseWelshWest IndianYakamaYaquiYugoslavianYumanYup'ikZimbabwean
Immigration
NonimmigrantsImmigrantsAfghanistanAfricaAlbaniaArgentinaArmeniaAsiaAustraliaAustriaBahamasBarbadosBelarusBelgiumBelizeBoliviaBosnia and HerzegovinaBrazilBulgariaBurma/MyanmarCabo VerdeCambodiaCameroonCanadaCaribbeanCentral AmericaChileChinaColombiaCongoCosta RicaCroatiaCubaCzechoslovakiaDenmarkDominicaDominican RepublicEastern AfricaEastern AsiaEastern EuropeEcuadorEgyptEl SalvadorEnglandEritreaEthiopiaEuropeFijiFranceGermanyGhanaGreeceGrenadaGuatemalaGuyanaHaitiHondurasHong KongHungaryIndiaIndonesiaIranIraqIrelandIsraelItalyJamaicaJapanJordanKazakhstanKenyaKoreaKuwaitLaosLatin AmericaLatviaLebanonLiberiaLithuaniaMalaysiaMexicoMicronesiaMiddle AfricaMoldovaMoroccoNepalNetherlandsNicaraguaNigeriaNorth AmericaNorth MacedoniaNorthern AfricaNorthern EuropeNorwayOceaniaPakistanPanamaPeruPhilippinesPolandPortugalRomaniaRussiaSaudi ArabiaScotlandSenegalSerbiaSierra LeoneSingaporeSomaliaSouth AfricaSouth AmericaSouth Central AsiaSouth Eastern AsiaSouthern EuropeSpainSri LankaSt. Vincent and the GrenadinesSudanSwedenSwitzerlandSyriaTaiwanThailandTrinidad and TobagoTurkeyUgandaUkraineUruguayUzbekistanVenezuelaVietnamWest IndiesWestern AfricaWestern AsiaWestern EuropeYemenZaireZimbabweAzores
Unemployment Among Ages 16 to 19 years
Income
Poverty
Unemployment
Labor Participation
Family Structure
Vehicle Availability
Education Level
Disability

Unemployment Among Ages 16 to 19 years Comparison

Immigrants from Bangladesh

Iroquois

Tragic
Average
21.5%
UNEMPLOYMENT AMONG AGES 16 TO 19 YEARS
0.0/ 100
METRIC RATING
308th/ 347
METRIC RANK
17.6%
UNEMPLOYMENT AMONG AGES 16 TO 19 YEARS
43.4/ 100
METRIC RATING
185th/ 347
METRIC RANK

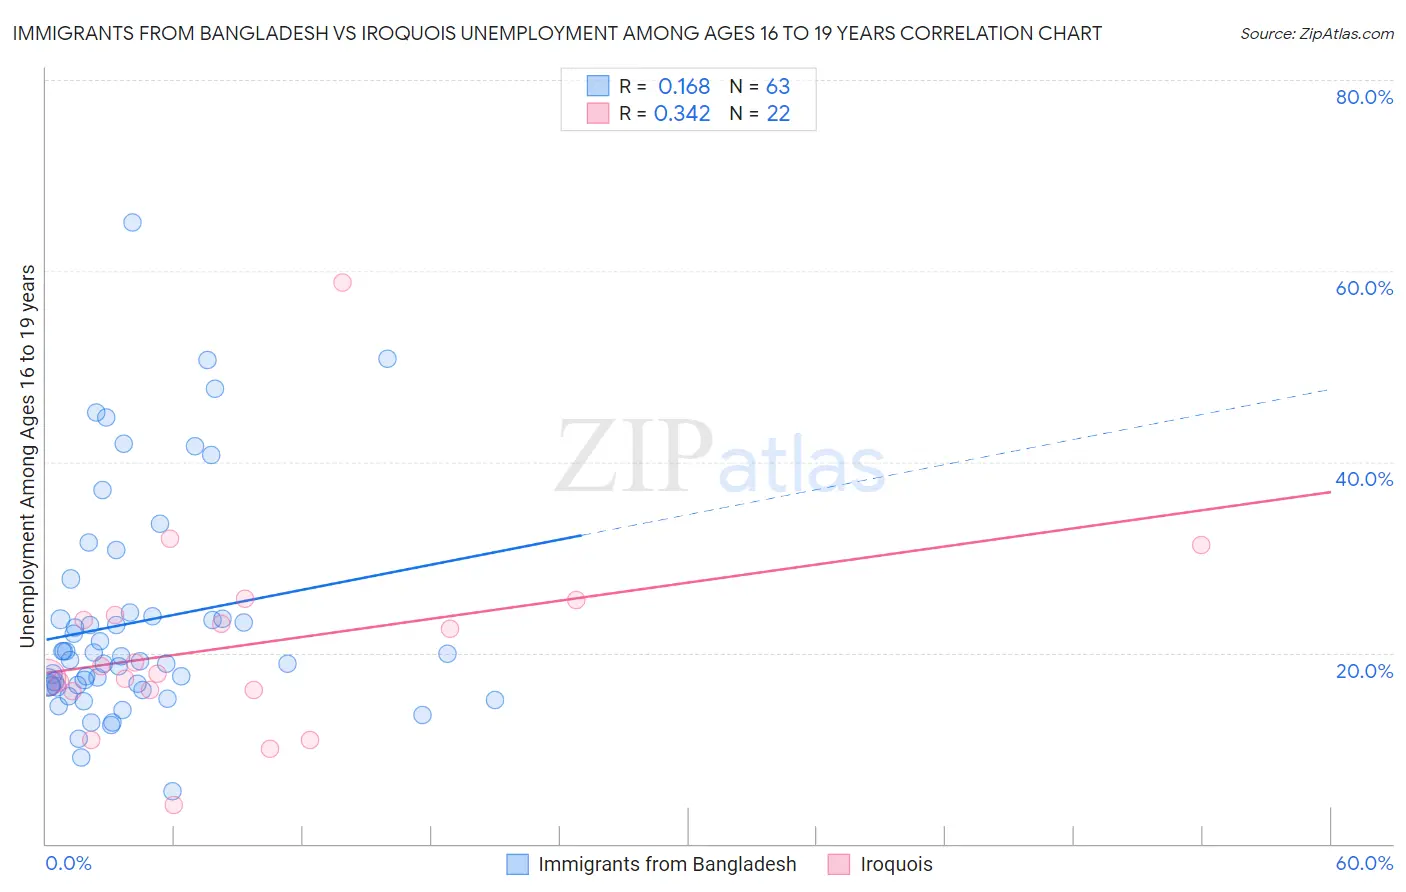
Immigrants from Bangladesh vs Iroquois Unemployment Among Ages 16 to 19 years Correlation Chart

The statistical analysis conducted on geographies consisting of 198,385,806 people shows a poor positive correlation between the proportion of Immigrants from Bangladesh and unemployment rate among population between the ages 16 and 19 in the United States with a correlation coefficient (R) of 0.168 and weighted average of 21.5%. Similarly, the statistical analysis conducted on geographies consisting of 200,302,978 people shows a mild positive correlation between the proportion of Iroquois and unemployment rate among population between the ages 16 and 19 in the United States with a correlation coefficient (R) of 0.342 and weighted average of 17.6%, a difference of 21.8%.
Immigrants from Bangladesh vs Iroquois Unemployment Among Ages 16 to 19 years

Unemployment Among Ages 16 to 19 years Correlation Summary

MeasurementImmigrants from BangladeshIroquois
Minimum5.5%4.0%
Maximum65.1%58.8%
Range59.6%54.8%
Mean23.2%20.8%
Median19.2%18.2%
Interquartile 25% (IQ1)16.5%16.1%
Interquartile 75% (IQ3)23.8%24.0%
Interquartile Range (IQR)7.3%7.9%
Standard Deviation (Sample)11.7%10.8%
Standard Deviation (Population)11.6%10.6%

Similar Demographics by Unemployment Among Ages 16 to 19 years

Demographics Similar to Immigrants from Bangladesh by Unemployment Among Ages 16 to 19 years

In terms of unemployment among ages 16 to 19 years, the demographic groups most similar to Immigrants from Bangladesh are Native/Alaskan (21.5%, a difference of 0.16%), Vietnamese (21.5%, a difference of 0.22%), Black/African American (21.4%, a difference of 0.38%), Belizean (21.6%, a difference of 0.44%), and Houma (21.6%, a difference of 0.70%).
DemographicsRating | RankUnemployment Among Ages 16 to 19 years
Immigrants | Ecuador
0.0
/100
|
#301
Tragic
20.9%
Immigrants | Caribbean
0.0
/100
|
#302
Tragic
20.9%
Senegalese
0.0
/100
|
#303
Tragic
21.0%
Aleuts
0.0
/100
|
#304
Tragic
21.2%
Immigrants | Senegal
0.0
/100
|
#305
Tragic
21.2%
U.S. Virgin Islanders
0.0
/100
|
#306
Tragic
21.3%
Blacks/African Americans
0.0
/100
|
#307
Tragic
21.4%
Immigrants | Bangladesh
0.0
/100
|
#308
Tragic
21.5%
Natives/Alaskans
0.0
/100
|
#309
Tragic
21.5%
Vietnamese
0.0
/100
|
#310
Tragic
21.5%
Belizeans
0.0
/100
|
#311
Tragic
21.6%
Houma
0.0
/100
|
#312
Tragic
21.6%
Jamaicans
0.0
/100
|
#313
Tragic
21.7%
Alaska Natives
0.0
/100
|
#314
Tragic
21.8%
Immigrants | Dominica
0.0
/100
|
#315
Tragic
21.9%

Demographics Similar to Iroquois by Unemployment Among Ages 16 to 19 years

In terms of unemployment among ages 16 to 19 years, the demographic groups most similar to Iroquois are Japanese (17.6%, a difference of 0.010%), Eastern European (17.6%, a difference of 0.040%), Immigrants from Uruguay (17.6%, a difference of 0.050%), Immigrants from Micronesia (17.6%, a difference of 0.050%), and Immigrants from Nicaragua (17.6%, a difference of 0.060%).
DemographicsRating | RankUnemployment Among Ages 16 to 19 years
Celtics
48.7
/100
|
#178
Average
17.6%
Americans
47.4
/100
|
#179
Average
17.6%
Spaniards
47.1
/100
|
#180
Average
17.6%
Immigrants | Turkey
45.6
/100
|
#181
Average
17.6%
Russians
45.2
/100
|
#182
Average
17.6%
Immigrants | Uruguay
44.6
/100
|
#183
Average
17.6%
Eastern Europeans
44.3
/100
|
#184
Average
17.6%
Iroquois
43.4
/100
|
#185
Average
17.6%
Japanese
43.2
/100
|
#186
Average
17.6%
Immigrants | Micronesia
42.4
/100
|
#187
Average
17.6%
Immigrants | Nicaragua
42.2
/100
|
#188
Average
17.6%
Immigrants | Europe
41.8
/100
|
#189
Average
17.6%
Marshallese
41.7
/100
|
#190
Average
17.6%
Immigrants | Costa Rica
41.3
/100
|
#191
Average
17.6%
Immigrants | Philippines
40.7
/100
|
#192
Average
17.7%