Scotch-Irish vs White/Caucasian Unemployment Among Ages 55 to 59 years
COMPARE
Scotch-Irish
White/Caucasian
Unemployment Among Ages 55 to 59 years
Unemployment Among Ages 55 to 59 years Comparison
Scotch-Irish
Whites/Caucasians
4.6%
UNEMPLOYMENT AMONG AGES 55 TO 59 YEARS
98.3/ 100
METRIC RATING
77th/ 347
METRIC RANK
4.7%
UNEMPLOYMENT AMONG AGES 55 TO 59 YEARS
90.7/ 100
METRIC RATING
119th/ 347
METRIC RANK
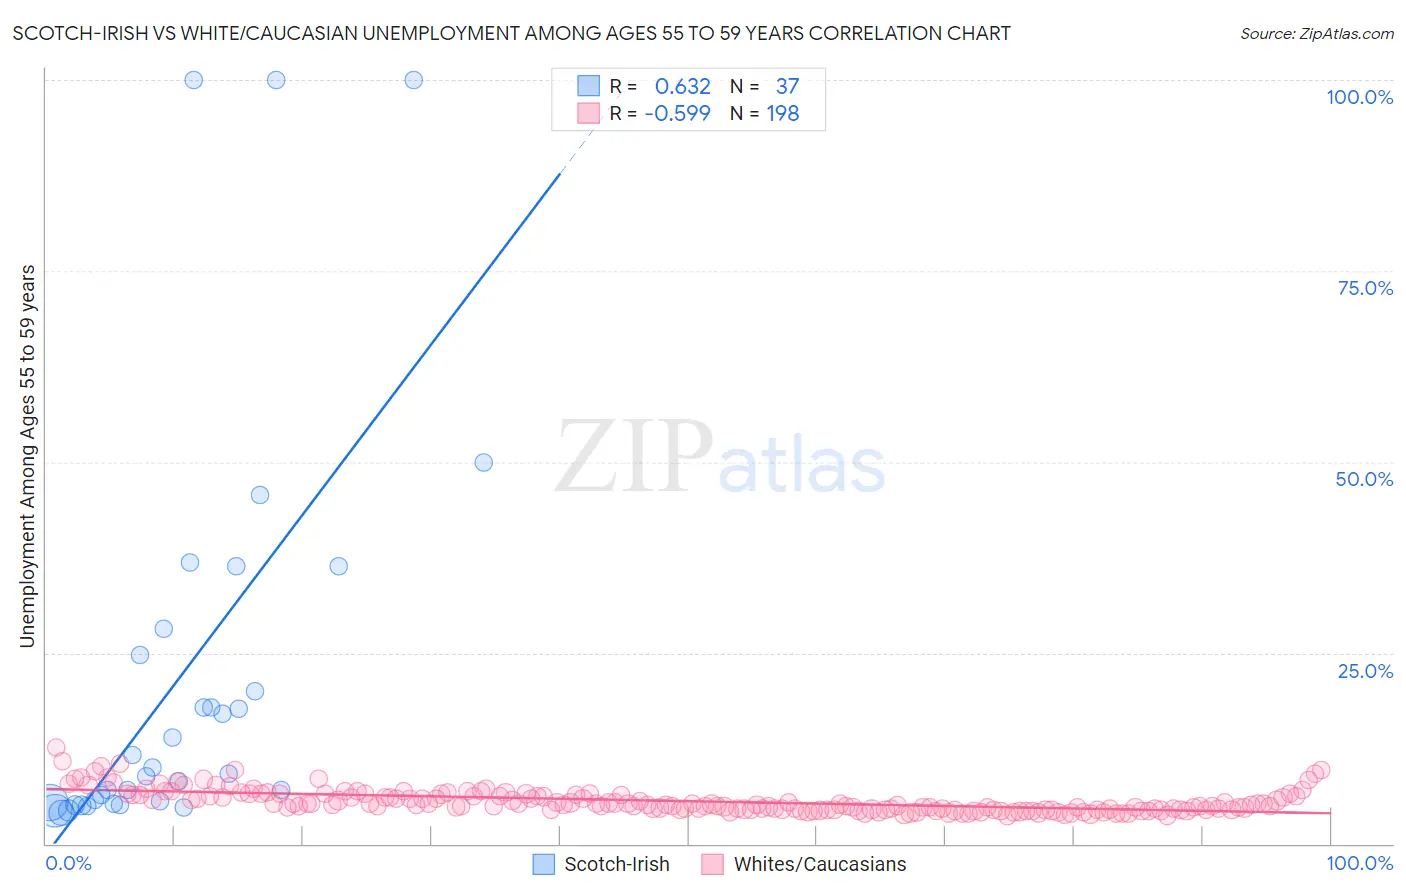
Scotch-Irish vs White/Caucasian Unemployment Among Ages 55 to 59 years Correlation Chart
The statistical analysis conducted on geographies consisting of 470,743,617 people shows a significant positive correlation between the proportion of Scotch-Irish and unemployment rate among population between the ages 55 and 59 in the United States with a correlation coefficient (R) of 0.632 and weighted average of 4.6%. Similarly, the statistical analysis conducted on geographies consisting of 492,133,782 people shows a substantial negative correlation between the proportion of Whites/Caucasians and unemployment rate among population between the ages 55 and 59 in the United States with a correlation coefficient (R) of -0.599 and weighted average of 4.7%, a difference of 1.9%.
Unemployment Among Ages 55 to 59 years Correlation Summary
| Measurement | Scotch-Irish | White/Caucasian |
| Minimum | 4.0% | 3.7% |
| Maximum | 100.0% | 12.5% |
| Range | 96.0% | 8.8% |
| Mean | 21.6% | 5.6% |
| Median | 9.2% | 5.1% |
| Interquartile 25% (IQ1) | 5.3% | 4.5% |
| Interquartile 75% (IQ3) | 26.5% | 6.3% |
| Interquartile Range (IQR) | 21.2% | 1.9% |
| Standard Deviation (Sample) | 26.7% | 1.5% |
| Standard Deviation (Population) | 26.3% | 1.5% |
Similar Demographics by Unemployment Among Ages 55 to 59 years
Demographics Similar to Scotch-Irish by Unemployment Among Ages 55 to 59 years
In terms of unemployment among ages 55 to 59 years, the demographic groups most similar to Scotch-Irish are Immigrants from Bosnia and Herzegovina (4.6%, a difference of 0.010%), Finnish (4.6%, a difference of 0.050%), Immigrants from Iraq (4.6%, a difference of 0.080%), Croatian (4.6%, a difference of 0.10%), and Sri Lankan (4.6%, a difference of 0.14%).
| Demographics | Rating | Rank | Unemployment Among Ages 55 to 59 years |
| Filipinos | 98.8 /100 | #70 | Exceptional 4.6% |
| Immigrants | Jordan | 98.7 /100 | #71 | Exceptional 4.6% |
| Immigrants | Taiwan | 98.7 /100 | #72 | Exceptional 4.6% |
| Bhutanese | 98.6 /100 | #73 | Exceptional 4.6% |
| Croatians | 98.5 /100 | #74 | Exceptional 4.6% |
| Immigrants | Iraq | 98.5 /100 | #75 | Exceptional 4.6% |
| Immigrants | Bosnia and Herzegovina | 98.3 /100 | #76 | Exceptional 4.6% |
| Scotch-Irish | 98.3 /100 | #77 | Exceptional 4.6% |
| Finns | 98.2 /100 | #78 | Exceptional 4.6% |
| Sri Lankans | 98.1 /100 | #79 | Exceptional 4.6% |
| Cambodians | 98.0 /100 | #80 | Exceptional 4.6% |
| Taiwanese | 97.9 /100 | #81 | Exceptional 4.6% |
| Latvians | 97.8 /100 | #82 | Exceptional 4.6% |
| Lebanese | 97.5 /100 | #83 | Exceptional 4.6% |
| Malaysians | 96.9 /100 | #84 | Exceptional 4.7% |
Demographics Similar to Whites/Caucasians by Unemployment Among Ages 55 to 59 years
In terms of unemployment among ages 55 to 59 years, the demographic groups most similar to Whites/Caucasians are Immigrants from Chile (4.7%, a difference of 0.0%), Turkish (4.7%, a difference of 0.020%), Asian (4.7%, a difference of 0.020%), South American Indian (4.7%, a difference of 0.030%), and Bangladeshi (4.7%, a difference of 0.080%).
| Demographics | Rating | Rank | Unemployment Among Ages 55 to 59 years |
| Afghans | 92.1 /100 | #112 | Exceptional 4.7% |
| Immigrants | Spain | 91.4 /100 | #113 | Exceptional 4.7% |
| Bangladeshis | 91.3 /100 | #114 | Exceptional 4.7% |
| South American Indians | 90.9 /100 | #115 | Exceptional 4.7% |
| Turks | 90.9 /100 | #116 | Exceptional 4.7% |
| Asians | 90.8 /100 | #117 | Exceptional 4.7% |
| Immigrants | Chile | 90.7 /100 | #118 | Exceptional 4.7% |
| Whites/Caucasians | 90.7 /100 | #119 | Exceptional 4.7% |
| Immigrants | South Africa | 89.9 /100 | #120 | Excellent 4.7% |
| Pakistanis | 89.7 /100 | #121 | Excellent 4.7% |
| Immigrants | Afghanistan | 89.5 /100 | #122 | Excellent 4.7% |
| Immigrants | Japan | 89.4 /100 | #123 | Excellent 4.7% |
| Lithuanians | 88.8 /100 | #124 | Excellent 4.7% |
| Immigrants | Malaysia | 87.9 /100 | #125 | Excellent 4.7% |
| Immigrants | Serbia | 87.8 /100 | #126 | Excellent 4.7% |