Scotch-Irish vs Immigrants from Uganda Unemployment Among Ages 55 to 59 years
COMPARE
Scotch-Irish
Immigrants from Uganda
Unemployment Among Ages 55 to 59 years
Unemployment Among Ages 55 to 59 years Comparison
Scotch-Irish
Immigrants from Uganda
4.6%
UNEMPLOYMENT AMONG AGES 55 TO 59 YEARS
98.3/ 100
METRIC RATING
77th/ 347
METRIC RANK
4.6%
UNEMPLOYMENT AMONG AGES 55 TO 59 YEARS
99.5/ 100
METRIC RATING
59th/ 347
METRIC RANK
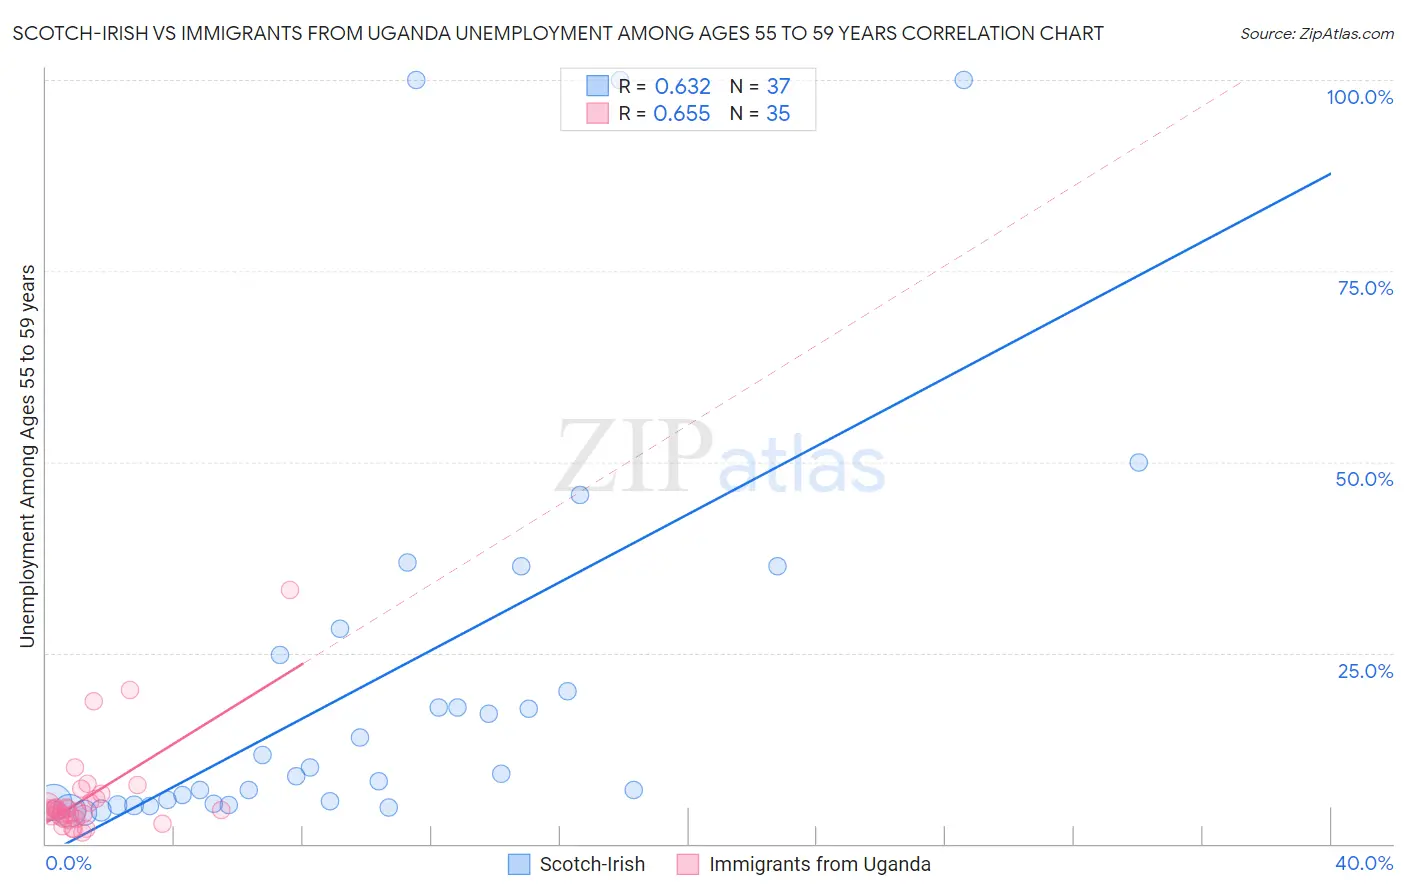
Scotch-Irish vs Immigrants from Uganda Unemployment Among Ages 55 to 59 years Correlation Chart
The statistical analysis conducted on geographies consisting of 470,743,617 people shows a significant positive correlation between the proportion of Scotch-Irish and unemployment rate among population between the ages 55 and 59 in the United States with a correlation coefficient (R) of 0.632 and weighted average of 4.6%. Similarly, the statistical analysis conducted on geographies consisting of 123,598,960 people shows a significant positive correlation between the proportion of Immigrants from Uganda and unemployment rate among population between the ages 55 and 59 in the United States with a correlation coefficient (R) of 0.655 and weighted average of 4.6%, a difference of 1.4%.
Unemployment Among Ages 55 to 59 years Correlation Summary
| Measurement | Scotch-Irish | Immigrants from Uganda |
| Minimum | 4.0% | 1.4% |
| Maximum | 100.0% | 33.3% |
| Range | 96.0% | 31.9% |
| Mean | 21.6% | 6.1% |
| Median | 9.2% | 4.4% |
| Interquartile 25% (IQ1) | 5.3% | 3.3% |
| Interquartile 75% (IQ3) | 26.5% | 5.9% |
| Interquartile Range (IQR) | 21.2% | 2.6% |
| Standard Deviation (Sample) | 26.7% | 6.2% |
| Standard Deviation (Population) | 26.3% | 6.1% |
Demographics Similar to Scotch-Irish and Immigrants from Uganda by Unemployment Among Ages 55 to 59 years
In terms of unemployment among ages 55 to 59 years, the demographic groups most similar to Scotch-Irish are Immigrants from Bosnia and Herzegovina (4.6%, a difference of 0.010%), Finnish (4.6%, a difference of 0.050%), Immigrants from Iraq (4.6%, a difference of 0.080%), Croatian (4.6%, a difference of 0.10%), and Bhutanese (4.6%, a difference of 0.18%). Similarly, the demographic groups most similar to Immigrants from Uganda are Dutch (4.6%, a difference of 0.050%), Immigrants from Argentina (4.6%, a difference of 0.13%), Okinawan (4.5%, a difference of 0.23%), Slovene (4.6%, a difference of 0.39%), and Immigrants from South Central Asia (4.6%, a difference of 0.46%).
| Demographics | Rating | Rank | Unemployment Among Ages 55 to 59 years |
| Okinawans | 99.6 /100 | #58 | Exceptional 4.5% |
| Immigrants | Uganda | 99.5 /100 | #59 | Exceptional 4.6% |
| Dutch | 99.5 /100 | #60 | Exceptional 4.6% |
| Immigrants | Argentina | 99.5 /100 | #61 | Exceptional 4.6% |
| Slovenes | 99.3 /100 | #62 | Exceptional 4.6% |
| Immigrants | South Central Asia | 99.3 /100 | #63 | Exceptional 4.6% |
| Argentineans | 99.1 /100 | #64 | Exceptional 4.6% |
| Sudanese | 99.1 /100 | #65 | Exceptional 4.6% |
| Mongolians | 99.0 /100 | #66 | Exceptional 4.6% |
| Ugandans | 99.0 /100 | #67 | Exceptional 4.6% |
| Immigrants | Micronesia | 99.0 /100 | #68 | Exceptional 4.6% |
| Czechoslovakians | 99.0 /100 | #69 | Exceptional 4.6% |
| Filipinos | 98.8 /100 | #70 | Exceptional 4.6% |
| Immigrants | Jordan | 98.7 /100 | #71 | Exceptional 4.6% |
| Immigrants | Taiwan | 98.7 /100 | #72 | Exceptional 4.6% |
| Bhutanese | 98.6 /100 | #73 | Exceptional 4.6% |
| Croatians | 98.5 /100 | #74 | Exceptional 4.6% |
| Immigrants | Iraq | 98.5 /100 | #75 | Exceptional 4.6% |
| Immigrants | Bosnia and Herzegovina | 98.3 /100 | #76 | Exceptional 4.6% |
| Scotch-Irish | 98.3 /100 | #77 | Exceptional 4.6% |
| Finns | 98.2 /100 | #78 | Exceptional 4.6% |