Puerto Rican vs Korean Unemployment Among Seniors over 75 years
COMPARE
Puerto Rican
Korean
Unemployment Among Seniors over 75 years
Unemployment Among Seniors over 75 years Comparison
Puerto Ricans
Koreans
9.4%
UNEMPLOYMENT AMONG SENIORS OVER 75 YEARS
0.3/ 100
METRIC RATING
269th/ 347
METRIC RANK
8.9%
UNEMPLOYMENT AMONG SENIORS OVER 75 YEARS
21.9/ 100
METRIC RATING
205th/ 347
METRIC RANK
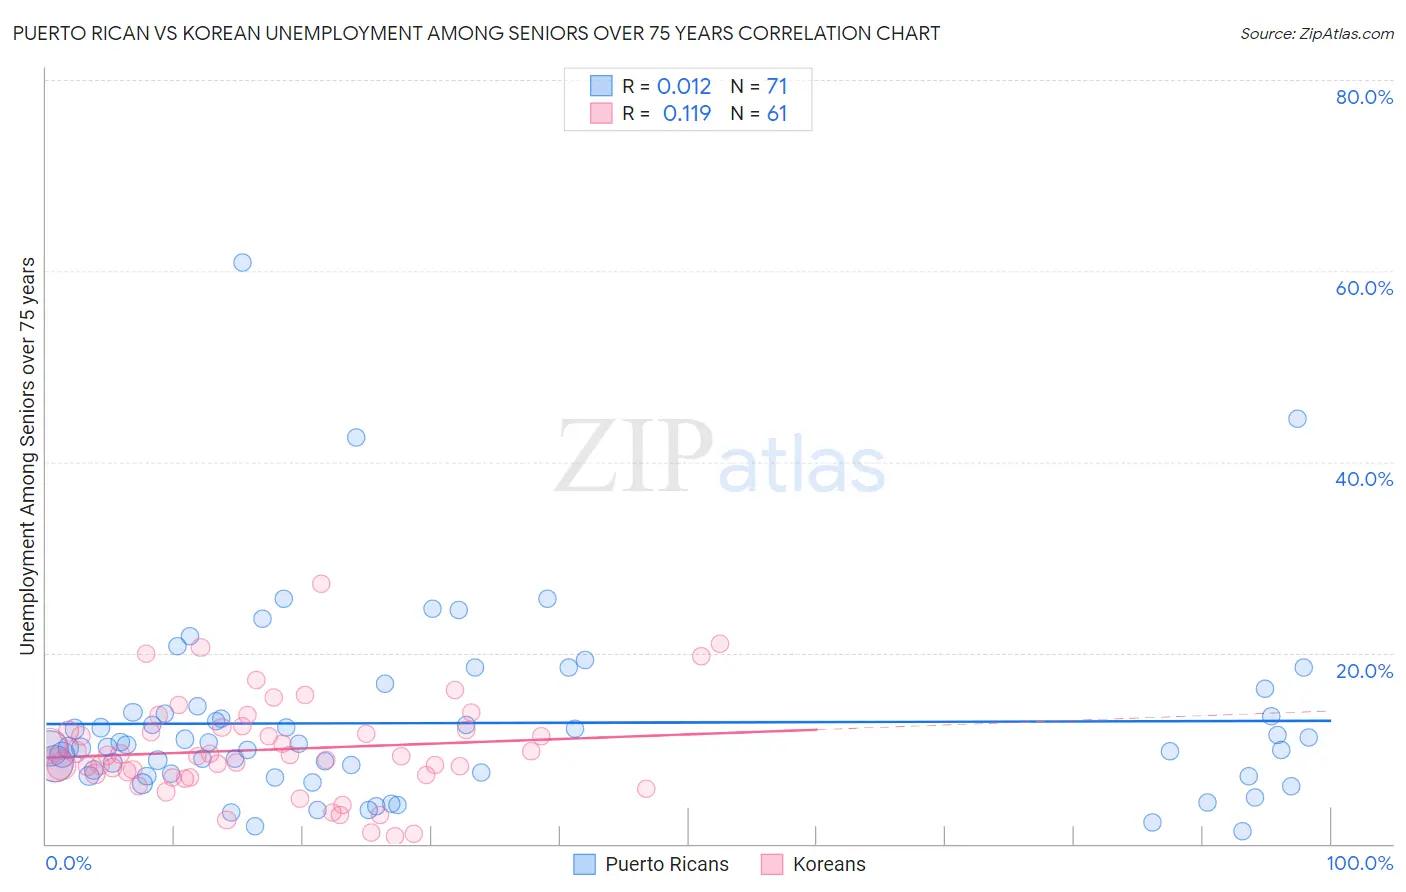
Puerto Rican vs Korean Unemployment Among Seniors over 75 years Correlation Chart
The statistical analysis conducted on geographies consisting of 230,993,925 people shows no correlation between the proportion of Puerto Ricans and unemployment rate among seniors over the age of 75 in the United States with a correlation coefficient (R) of 0.012 and weighted average of 9.4%. Similarly, the statistical analysis conducted on geographies consisting of 228,730,103 people shows a poor positive correlation between the proportion of Koreans and unemployment rate among seniors over the age of 75 in the United States with a correlation coefficient (R) of 0.119 and weighted average of 8.9%, a difference of 5.8%.
Unemployment Among Seniors over 75 years Correlation Summary
| Measurement | Puerto Rican | Korean |
| Minimum | 1.3% | 0.80% |
| Maximum | 60.9% | 27.2% |
| Range | 59.6% | 26.4% |
| Mean | 12.6% | 9.9% |
| Median | 10.1% | 9.2% |
| Interquartile 25% (IQ1) | 7.1% | 7.1% |
| Interquartile 75% (IQ3) | 13.8% | 12.1% |
| Interquartile Range (IQR) | 6.6% | 5.0% |
| Standard Deviation (Sample) | 9.9% | 5.2% |
| Standard Deviation (Population) | 9.8% | 5.1% |
Similar Demographics by Unemployment Among Seniors over 75 years
Demographics Similar to Puerto Ricans by Unemployment Among Seniors over 75 years
In terms of unemployment among seniors over 75 years, the demographic groups most similar to Puerto Ricans are Yaqui (9.4%, a difference of 0.090%), Greek (9.4%, a difference of 0.14%), Bulgarian (9.4%, a difference of 0.17%), Immigrants from Iraq (9.4%, a difference of 0.20%), and Immigrants from Mexico (9.4%, a difference of 0.30%).
| Demographics | Rating | Rank | Unemployment Among Seniors over 75 years |
| Austrians | 0.7 /100 | #262 | Tragic 9.3% |
| Ukrainians | 0.7 /100 | #263 | Tragic 9.3% |
| Iroquois | 0.7 /100 | #264 | Tragic 9.3% |
| Palestinians | 0.6 /100 | #265 | Tragic 9.3% |
| Blacks/African Americans | 0.5 /100 | #266 | Tragic 9.4% |
| Immigrants | Mexico | 0.4 /100 | #267 | Tragic 9.4% |
| Greeks | 0.4 /100 | #268 | Tragic 9.4% |
| Puerto Ricans | 0.3 /100 | #269 | Tragic 9.4% |
| Yaqui | 0.3 /100 | #270 | Tragic 9.4% |
| Bulgarians | 0.3 /100 | #271 | Tragic 9.4% |
| Immigrants | Iraq | 0.3 /100 | #272 | Tragic 9.4% |
| Czechoslovakians | 0.3 /100 | #273 | Tragic 9.4% |
| Jamaicans | 0.2 /100 | #274 | Tragic 9.5% |
| Senegalese | 0.2 /100 | #275 | Tragic 9.5% |
| Arabs | 0.2 /100 | #276 | Tragic 9.5% |
Demographics Similar to Koreans by Unemployment Among Seniors over 75 years
In terms of unemployment among seniors over 75 years, the demographic groups most similar to Koreans are Spaniard (8.9%, a difference of 0.010%), Immigrants from Northern Europe (8.9%, a difference of 0.15%), Russian (8.9%, a difference of 0.17%), Immigrants from Peru (8.9%, a difference of 0.18%), and Pakistani (8.9%, a difference of 0.26%).
| Demographics | Rating | Rank | Unemployment Among Seniors over 75 years |
| Eastern Europeans | 25.9 /100 | #198 | Fair 8.9% |
| Pakistanis | 25.4 /100 | #199 | Fair 8.9% |
| Osage | 25.4 /100 | #200 | Fair 8.9% |
| Immigrants | Peru | 24.3 /100 | #201 | Fair 8.9% |
| Russians | 24.1 /100 | #202 | Fair 8.9% |
| Immigrants | Northern Europe | 23.9 /100 | #203 | Fair 8.9% |
| Spaniards | 22.0 /100 | #204 | Fair 8.9% |
| Koreans | 21.9 /100 | #205 | Fair 8.9% |
| Immigrants | Western Europe | 18.2 /100 | #206 | Poor 8.9% |
| Malaysians | 16.3 /100 | #207 | Poor 8.9% |
| Immigrants | Philippines | 15.8 /100 | #208 | Poor 8.9% |
| Salvadorans | 15.4 /100 | #209 | Poor 8.9% |
| Bermudans | 15.0 /100 | #210 | Poor 8.9% |
| Delaware | 14.6 /100 | #211 | Poor 9.0% |
| Romanians | 13.8 /100 | #212 | Poor 9.0% |