Immigrants from Germany vs Korean Unemployment Among Seniors over 75 years

COMPARE

Immigrants from Germany
Race
Ancestry
AfghanAfricanAlaska NativeAlaskan AthabascanAlbanianAleutAlsatianAmericanApacheArabArapahoArgentineanArmenianAssyrian/Chaldean/SyriacAustralianAustrianBahamianBangladeshiBarbadianBasqueBelgianBelizeanBermudanBhutaneseBlackfeetBolivianBrazilianBritishBritish West IndianBulgarianBurmeseCajunCambodianCanadianCape VerdeanCarpatho RusynCelticCentral AmericanCentral American IndianCherokeeCheyenneChickasawChileanChineseChippewaChoctawColombianColvilleComancheCosta RicanCreeCreekCroatianCrowCubanCypriotCzechCzechoslovakianDanishDelawareDominicanDutchDutch West IndianEastern EuropeanEcuadorianEgyptianEnglishEstonianEthiopianEuropeanFijianFilipinoFinnishFrenchFrench American IndianFrench CanadianGermanGerman RussianGhanaianGreekGuamanian/ChamorroGuatemalanGuyaneseHaitianHmongHonduranHopiHoumaHungarianIcelanderIndian (Asian)IndonesianInupiatIranianIraqiIrishIroquoisIsraeliItalianJamaicanJapaneseJordanianKenyanKiowaLaotianLatvianLebaneseLiberianLithuanianLumbeeLuxembourgerMacedonianMalaysianMalteseMarshalleseMexicanMexican American IndianMongolianMoroccanNative HawaiianNavajoNepaleseNew ZealanderNicaraguanNigerianNorthern EuropeanNorwegianOkinawanOsageOttawaPaiutePakistaniPalestinianPanamanianParaguayanPennsylvania GermanPeruvianPimaPolishPortuguesePotawatomiPuebloPuerto RicanPuget Sound SalishRomanianRussianSalvadoranSamoanScandinavianScotch-IrishScottishSeminoleSenegaleseSerbianShoshoneSierra LeoneanSiouxSlavicSlovakSloveneSomaliSouth AfricanSouth AmericanSouth American IndianSoviet UnionSpaniardSpanishSpanish AmericanSpanish American IndianSri LankanSubsaharan AfricanSudaneseSwedishSwissSyrianTaiwaneseThaiTlingit-HaidaTohono O'OdhamTonganTrinidadian and TobagonianTsimshianTurkishU.S. Virgin IslanderUgandanUkrainianUruguayanUteVenezuelanVietnameseWelshWest IndianYakamaYaquiYugoslavianYumanYup'ikZimbabwean
Immigration
NonimmigrantsImmigrantsAfghanistanAfricaAlbaniaArgentinaArmeniaAsiaAustraliaAustriaBahamasBangladeshBarbadosBelarusBelgiumBelizeBoliviaBosnia and HerzegovinaBrazilBulgariaBurma/MyanmarCabo VerdeCambodiaCameroonCanadaCaribbeanCentral AmericaChileChinaColombiaCongoCosta RicaCroatiaCubaCzechoslovakiaDenmarkDominicaDominican RepublicEastern AfricaEastern AsiaEastern EuropeEcuadorEgyptEl SalvadorEnglandEritreaEthiopiaEuropeFijiFranceGermanyGhanaGreeceGrenadaGuatemalaGuyanaHaitiHondurasHong KongHungaryIndiaIndonesiaIranIraqIrelandIsraelItalyJamaicaJapanJordanKazakhstanKenyaKoreaKuwaitLaosLatin AmericaLatviaLebanonLiberiaLithuaniaMalaysiaMexicoMicronesiaMiddle AfricaMoldovaMoroccoNepalNetherlandsNicaraguaNigeriaNorth AmericaNorth MacedoniaNorthern AfricaNorthern EuropeNorwayOceaniaPakistanPanamaPeruPhilippinesPolandPortugalRomaniaRussiaSaudi ArabiaScotlandSenegalSerbiaSierra LeoneSingaporeSomaliaSouth AfricaSouth AmericaSouth Central AsiaSouth Eastern AsiaSouthern EuropeSpainSri LankaSt. Vincent and the GrenadinesSudanSwedenSwitzerlandSyriaTaiwanThailandTrinidad and TobagoTurkeyUgandaUkraineUruguayUzbekistanVenezuelaVietnamWest IndiesWestern AfricaWestern AsiaWestern EuropeYemenZaireZimbabweAzores
Korean
Race
Ancestry
AfghanAfricanAlaska NativeAlaskan AthabascanAlbanianAleutAlsatianAmericanApacheArabArapahoArgentineanArmenianAssyrian/Chaldean/SyriacAustralianAustrianBahamianBangladeshiBarbadianBasqueBelgianBelizeanBermudanBhutaneseBlackfeetBolivianBrazilianBritishBritish West IndianBulgarianBurmeseCajunCambodianCanadianCape VerdeanCarpatho RusynCelticCentral AmericanCentral American IndianCherokeeCheyenneChickasawChileanChineseChippewaChoctawColombianColvilleComancheCosta RicanCreeCreekCroatianCrowCubanCypriotCzechCzechoslovakianDanishDelawareDominicanDutchDutch West IndianEastern EuropeanEcuadorianEgyptianEnglishEstonianEthiopianEuropeanFijianFilipinoFinnishFrenchFrench American IndianFrench CanadianGermanGerman RussianGhanaianGreekGuamanian/ChamorroGuatemalanGuyaneseHaitianHmongHonduranHopiHoumaHungarianIcelanderIndian (Asian)IndonesianInupiatIranianIraqiIrishIroquoisIsraeliItalianJamaicanJapaneseJordanianKenyanKiowaKoreanLaotianLatvianLebaneseLiberianLithuanianLumbeeLuxembourgerMacedonianMalaysianMalteseMarshalleseMexicanMexican American IndianMongolianMoroccanNative HawaiianNavajoNepaleseNew ZealanderNicaraguanNigerianNorthern EuropeanNorwegianOkinawanOsageOttawaPaiutePakistaniPalestinianPanamanianParaguayanPennsylvania GermanPeruvianPimaPolishPortuguesePotawatomiPuebloPuerto RicanPuget Sound SalishRomanianRussianSalvadoranSamoanScandinavianScotch-IrishScottishSeminoleSenegaleseSerbianShoshoneSierra LeoneanSiouxSlavicSlovakSloveneSomaliSouth AfricanSouth AmericanSouth American IndianSoviet UnionSpaniardSpanishSpanish AmericanSpanish American IndianSri LankanSubsaharan AfricanSudaneseSwedishSwissSyrianTaiwaneseThaiTlingit-HaidaTohono O'OdhamTonganTrinidadian and TobagonianTsimshianTurkishU.S. Virgin IslanderUgandanUkrainianUruguayanUteVenezuelanVietnameseWelshWest IndianYakamaYaquiYugoslavianYumanYup'ikZimbabwean
Immigration
NonimmigrantsImmigrantsAfghanistanAfricaAlbaniaArgentinaArmeniaAsiaAustraliaAustriaBahamasBangladeshBarbadosBelarusBelgiumBelizeBoliviaBosnia and HerzegovinaBrazilBulgariaBurma/MyanmarCabo VerdeCambodiaCameroonCanadaCaribbeanCentral AmericaChileChinaColombiaCongoCosta RicaCroatiaCubaCzechoslovakiaDenmarkDominicaDominican RepublicEastern AfricaEastern AsiaEastern EuropeEcuadorEgyptEl SalvadorEnglandEritreaEthiopiaEuropeFijiFranceGhanaGreeceGrenadaGuatemalaGuyanaHaitiHondurasHong KongHungaryIndiaIndonesiaIranIraqIrelandIsraelItalyJamaicaJapanJordanKazakhstanKenyaKoreaKuwaitLaosLatin AmericaLatviaLebanonLiberiaLithuaniaMalaysiaMexicoMicronesiaMiddle AfricaMoldovaMoroccoNepalNetherlandsNicaraguaNigeriaNorth AmericaNorth MacedoniaNorthern AfricaNorthern EuropeNorwayOceaniaPakistanPanamaPeruPhilippinesPolandPortugalRomaniaRussiaSaudi ArabiaScotlandSenegalSerbiaSierra LeoneSingaporeSomaliaSouth AfricaSouth AmericaSouth Central AsiaSouth Eastern AsiaSouthern EuropeSpainSri LankaSt. Vincent and the GrenadinesSudanSwedenSwitzerlandSyriaTaiwanThailandTrinidad and TobagoTurkeyUgandaUkraineUruguayUzbekistanVenezuelaVietnamWest IndiesWestern AfricaWestern AsiaWestern EuropeYemenZaireZimbabweAzores
Unemployment Among Seniors over 75 years
Income
Poverty
Unemployment
Labor Participation
Family Structure
Vehicle Availability
Education Level
Disability

Unemployment Among Seniors over 75 years Comparison

Immigrants from Germany

Koreans

Tragic
Fair
9.2%
UNEMPLOYMENT AMONG SENIORS OVER 75 YEARS
2.7/ 100
METRIC RATING
244th/ 347
METRIC RANK
8.9%
UNEMPLOYMENT AMONG SENIORS OVER 75 YEARS
21.9/ 100
METRIC RATING
205th/ 347
METRIC RANK

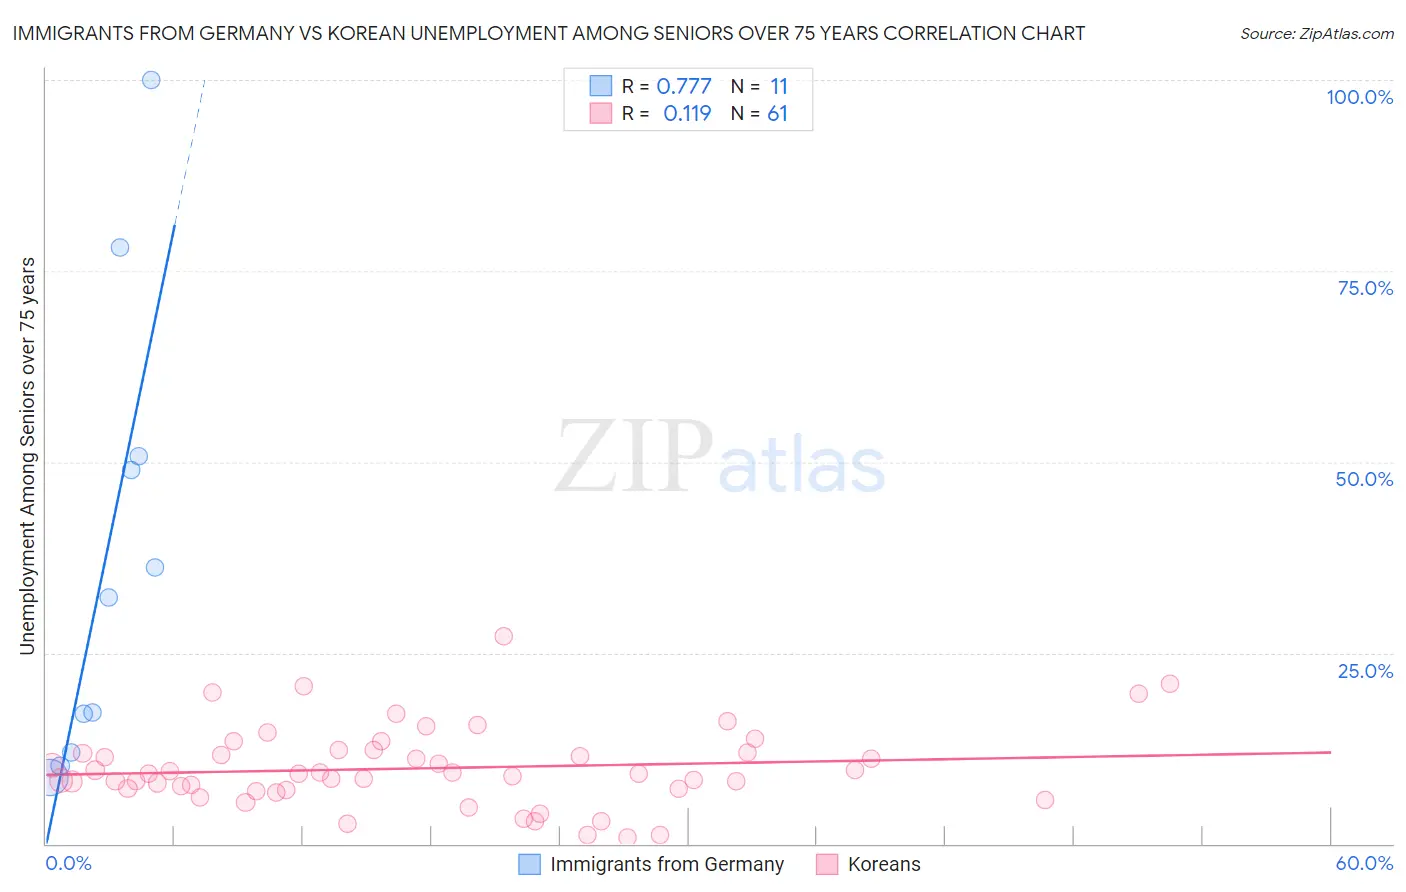
Immigrants from Germany vs Korean Unemployment Among Seniors over 75 years Correlation Chart

The statistical analysis conducted on geographies consisting of 218,928,696 people shows a strong positive correlation between the proportion of Immigrants from Germany and unemployment rate among seniors over the age of 75 in the United States with a correlation coefficient (R) of 0.777 and weighted average of 9.2%. Similarly, the statistical analysis conducted on geographies consisting of 228,730,103 people shows a poor positive correlation between the proportion of Koreans and unemployment rate among seniors over the age of 75 in the United States with a correlation coefficient (R) of 0.119 and weighted average of 8.9%, a difference of 3.0%.
Immigrants from Germany vs Korean Unemployment Among Seniors over 75 years

Unemployment Among Seniors over 75 years Correlation Summary

MeasurementImmigrants from GermanyKorean
Minimum8.7%0.80%
Maximum100.0%27.2%
Range91.3%26.4%
Mean37.4%9.9%
Median32.3%9.2%
Interquartile 25% (IQ1)12.0%7.1%
Interquartile 75% (IQ3)50.7%12.1%
Interquartile Range (IQR)38.7%5.0%
Standard Deviation (Sample)29.9%5.2%
Standard Deviation (Population)28.5%5.1%

Similar Demographics by Unemployment Among Seniors over 75 years

Demographics Similar to Immigrants from Germany by Unemployment Among Seniors over 75 years

In terms of unemployment among seniors over 75 years, the demographic groups most similar to Immigrants from Germany are Sierra Leonean (9.2%, a difference of 0.030%), Slavic (9.2%, a difference of 0.030%), Immigrants from Southern Europe (9.2%, a difference of 0.060%), Immigrants from Canada (9.2%, a difference of 0.060%), and Immigrants from North America (9.2%, a difference of 0.18%).
DemographicsRating | RankUnemployment Among Seniors over 75 years
Houma
3.9
/100
|
#237
Tragic
9.1%
Inupiat
3.6
/100
|
#238
Tragic
9.1%
Mexicans
3.5
/100
|
#239
Tragic
9.1%
Spanish
3.3
/100
|
#240
Tragic
9.1%
Immigrants | Southern Europe
2.8
/100
|
#241
Tragic
9.2%
Sierra Leoneans
2.8
/100
|
#242
Tragic
9.2%
Slavs
2.8
/100
|
#243
Tragic
9.2%
Immigrants | Germany
2.7
/100
|
#244
Tragic
9.2%
Immigrants | Canada
2.6
/100
|
#245
Tragic
9.2%
Immigrants | North America
2.4
/100
|
#246
Tragic
9.2%
Sub-Saharan Africans
2.3
/100
|
#247
Tragic
9.2%
Blackfeet
2.3
/100
|
#248
Tragic
9.2%
Immigrants | Saudi Arabia
2.2
/100
|
#249
Tragic
9.2%
Central American Indians
2.2
/100
|
#250
Tragic
9.2%
Immigrants | Poland
2.0
/100
|
#251
Tragic
9.2%

Demographics Similar to Koreans by Unemployment Among Seniors over 75 years

In terms of unemployment among seniors over 75 years, the demographic groups most similar to Koreans are Spaniard (8.9%, a difference of 0.010%), Immigrants from Northern Europe (8.9%, a difference of 0.15%), Russian (8.9%, a difference of 0.17%), Immigrants from Peru (8.9%, a difference of 0.18%), and Pakistani (8.9%, a difference of 0.26%).
DemographicsRating | RankUnemployment Among Seniors over 75 years
Eastern Europeans
25.9
/100
|
#198
Fair
8.9%
Pakistanis
25.4
/100
|
#199
Fair
8.9%
Osage
25.4
/100
|
#200
Fair
8.9%
Immigrants | Peru
24.3
/100
|
#201
Fair
8.9%
Russians
24.1
/100
|
#202
Fair
8.9%
Immigrants | Northern Europe
23.9
/100
|
#203
Fair
8.9%
Spaniards
22.0
/100
|
#204
Fair
8.9%
Koreans
21.9
/100
|
#205
Fair
8.9%
Immigrants | Western Europe
18.2
/100
|
#206
Poor
8.9%
Malaysians
16.3
/100
|
#207
Poor
8.9%
Immigrants | Philippines
15.8
/100
|
#208
Poor
8.9%
Salvadorans
15.4
/100
|
#209
Poor
8.9%
Bermudans
15.0
/100
|
#210
Poor
8.9%
Delaware
14.6
/100
|
#211
Poor
9.0%
Romanians
13.8
/100
|
#212
Poor
9.0%