Panamanian vs Ukrainian Unemployment Among Women with Children Under 6 years

COMPARE

Panamanian
Race
Ancestry
AfghanAfricanAlaska NativeAlaskan AthabascanAlbanianAleutAlsatianAmericanApacheArabArapahoArgentineanArmenianAssyrian/Chaldean/SyriacAustralianAustrianBahamianBangladeshiBarbadianBasqueBelgianBelizeanBermudanBhutaneseBlackfeetBolivianBrazilianBritishBritish West IndianBulgarianBurmeseCajunCambodianCanadianCape VerdeanCarpatho RusynCelticCentral AmericanCentral American IndianCherokeeCheyenneChickasawChileanChineseChippewaChoctawColombianColvilleComancheCosta RicanCreeCreekCroatianCrowCubanCypriotCzechCzechoslovakianDanishDelawareDominicanDutchDutch West IndianEastern EuropeanEcuadorianEgyptianEnglishEstonianEthiopianEuropeanFijianFilipinoFinnishFrenchFrench American IndianFrench CanadianGermanGerman RussianGhanaianGreekGuamanian/ChamorroGuatemalanGuyaneseHaitianHmongHonduranHopiHoumaHungarianIcelanderIndian (Asian)IndonesianInupiatIranianIraqiIrishIroquoisIsraeliItalianJamaicanJapaneseJordanianKenyanKiowaKoreanLaotianLatvianLebaneseLiberianLithuanianLumbeeLuxembourgerMacedonianMalaysianMalteseMarshalleseMenomineeMexicanMexican American IndianMongolianMoroccanNative HawaiianNavajoNepaleseNew ZealanderNicaraguanNigerianNorthern EuropeanNorwegianOkinawanOsageOttawaPaiutePakistaniPalestinianPanamanianParaguayanPennsylvania GermanPeruvianPimaPolishPortuguesePotawatomiPuebloPuerto RicanPuget Sound SalishRomanianRussianSalvadoranSamoanScandinavianScotch-IrishScottishSeminoleSenegaleseSerbianShoshoneSierra LeoneanSiouxSlavicSlovakSloveneSomaliSouth AfricanSouth AmericanSouth American IndianSoviet UnionSpaniardSpanishSpanish AmericanSpanish American IndianSri LankanSubsaharan AfricanSudaneseSwedishSwissSyrianTaiwaneseThaiTlingit-HaidaTohono O'OdhamTonganTrinidadian and TobagonianTsimshianTurkishU.S. Virgin IslanderUgandanUruguayanUteVenezuelanVietnameseWelshWest IndianYakamaYaquiYugoslavianYumanYup'ikZimbabwean
Immigration
NonimmigrantsImmigrantsAfghanistanAfricaAlbaniaArgentinaArmeniaAsiaAustraliaAustriaBahamasBangladeshBarbadosBelarusBelgiumBelizeBoliviaBosnia and HerzegovinaBrazilBulgariaBurma/MyanmarCabo VerdeCambodiaCameroonCanadaCaribbeanCentral AmericaChileChinaColombiaCongoCosta RicaCroatiaCubaCzechoslovakiaDenmarkDominicaDominican RepublicEastern AfricaEastern AsiaEastern EuropeEcuadorEgyptEl SalvadorEnglandEritreaEthiopiaEuropeFijiFranceGermanyGhanaGreeceGrenadaGuatemalaGuyanaHaitiHondurasHong KongHungaryIndiaIndonesiaIranIraqIrelandIsraelItalyJamaicaJapanJordanKazakhstanKenyaKoreaKuwaitLaosLatin AmericaLatviaLebanonLiberiaLithuaniaMalaysiaMexicoMicronesiaMiddle AfricaMoldovaMoroccoNepalNetherlandsNicaraguaNigeriaNorth AmericaNorth MacedoniaNorthern AfricaNorthern EuropeNorwayOceaniaPakistanPanamaPeruPhilippinesPolandPortugalRomaniaRussiaSaudi ArabiaScotlandSenegalSerbiaSierra LeoneSingaporeSomaliaSouth AfricaSouth AmericaSouth Central AsiaSouth Eastern AsiaSouthern EuropeSpainSri LankaSt. Vincent and the GrenadinesSudanSwedenSwitzerlandSyriaTaiwanThailandTrinidad and TobagoTurkeyUgandaUkraineUruguayUzbekistanVenezuelaVietnamWest IndiesWestern AfricaWestern AsiaWestern EuropeYemenZaireZimbabweAzores
Ukrainian
Race
Ancestry
AfghanAfricanAlaska NativeAlaskan AthabascanAlbanianAleutAlsatianAmericanApacheArabArapahoArgentineanArmenianAssyrian/Chaldean/SyriacAustralianAustrianBahamianBangladeshiBarbadianBasqueBelgianBelizeanBermudanBhutaneseBlackfeetBolivianBrazilianBritishBritish West IndianBulgarianBurmeseCajunCambodianCanadianCape VerdeanCarpatho RusynCelticCentral AmericanCentral American IndianCherokeeCheyenneChickasawChileanChineseChippewaChoctawColombianColvilleComancheCosta RicanCreeCreekCroatianCrowCubanCypriotCzechCzechoslovakianDanishDelawareDominicanDutchDutch West IndianEastern EuropeanEcuadorianEgyptianEnglishEstonianEthiopianEuropeanFijianFilipinoFinnishFrenchFrench American IndianFrench CanadianGermanGerman RussianGhanaianGreekGuamanian/ChamorroGuatemalanGuyaneseHaitianHmongHonduranHopiHoumaHungarianIcelanderIndian (Asian)IndonesianInupiatIranianIraqiIrishIroquoisIsraeliItalianJamaicanJapaneseJordanianKenyanKiowaKoreanLaotianLatvianLebaneseLiberianLithuanianLumbeeLuxembourgerMacedonianMalaysianMalteseMarshalleseMenomineeMexicanMexican American IndianMongolianMoroccanNative HawaiianNavajoNepaleseNew ZealanderNicaraguanNigerianNorthern EuropeanNorwegianOkinawanOsageOttawaPaiutePakistaniPalestinianParaguayanPennsylvania GermanPeruvianPimaPolishPortuguesePotawatomiPuebloPuerto RicanPuget Sound SalishRomanianRussianSalvadoranSamoanScandinavianScotch-IrishScottishSeminoleSenegaleseSerbianShoshoneSierra LeoneanSiouxSlavicSlovakSloveneSomaliSouth AfricanSouth AmericanSouth American IndianSoviet UnionSpaniardSpanishSpanish AmericanSpanish American IndianSri LankanSubsaharan AfricanSudaneseSwedishSwissSyrianTaiwaneseThaiTlingit-HaidaTohono O'OdhamTonganTrinidadian and TobagonianTsimshianTurkishU.S. Virgin IslanderUgandanUkrainianUruguayanUteVenezuelanVietnameseWelshWest IndianYakamaYaquiYugoslavianYumanYup'ikZimbabwean
Immigration
NonimmigrantsImmigrantsAfghanistanAfricaAlbaniaArgentinaArmeniaAsiaAustraliaAustriaBahamasBangladeshBarbadosBelarusBelgiumBelizeBoliviaBosnia and HerzegovinaBrazilBulgariaBurma/MyanmarCabo VerdeCambodiaCameroonCanadaCaribbeanCentral AmericaChileChinaColombiaCongoCosta RicaCroatiaCubaCzechoslovakiaDenmarkDominicaDominican RepublicEastern AfricaEastern AsiaEastern EuropeEcuadorEgyptEl SalvadorEnglandEritreaEthiopiaEuropeFijiFranceGermanyGhanaGreeceGrenadaGuatemalaGuyanaHaitiHondurasHong KongHungaryIndiaIndonesiaIranIraqIrelandIsraelItalyJamaicaJapanJordanKazakhstanKenyaKoreaKuwaitLaosLatin AmericaLatviaLebanonLiberiaLithuaniaMalaysiaMexicoMicronesiaMiddle AfricaMoldovaMoroccoNepalNetherlandsNicaraguaNigeriaNorth AmericaNorth MacedoniaNorthern AfricaNorthern EuropeNorwayOceaniaPakistanPanamaPeruPhilippinesPolandPortugalRomaniaRussiaSaudi ArabiaScotlandSenegalSerbiaSierra LeoneSingaporeSomaliaSouth AfricaSouth AmericaSouth Central AsiaSouth Eastern AsiaSouthern EuropeSpainSri LankaSt. Vincent and the GrenadinesSudanSwedenSwitzerlandSyriaTaiwanThailandTrinidad and TobagoTurkeyUgandaUkraineUruguayUzbekistanVenezuelaVietnamWest IndiesWestern AfricaWestern AsiaWestern EuropeYemenZaireZimbabweAzores
Unemployment Among Women with Children Under 6 years
Income
Poverty
Unemployment
Labor Participation
Family Structure
Vehicle Availability
Education Level
Disability

Unemployment Among Women with Children Under 6 years Comparison

Panamanians

Ukrainians

Average
Excellent
7.6%
UNEMPLOYMENT AMONG WOMEN WITH CHILDREN UNDER 6 YEARS
49.6/ 100
METRIC RATING
175th/ 347
METRIC RANK
7.4%
UNEMPLOYMENT AMONG WOMEN WITH CHILDREN UNDER 6 YEARS
88.2/ 100
METRIC RATING
131st/ 347
METRIC RANK

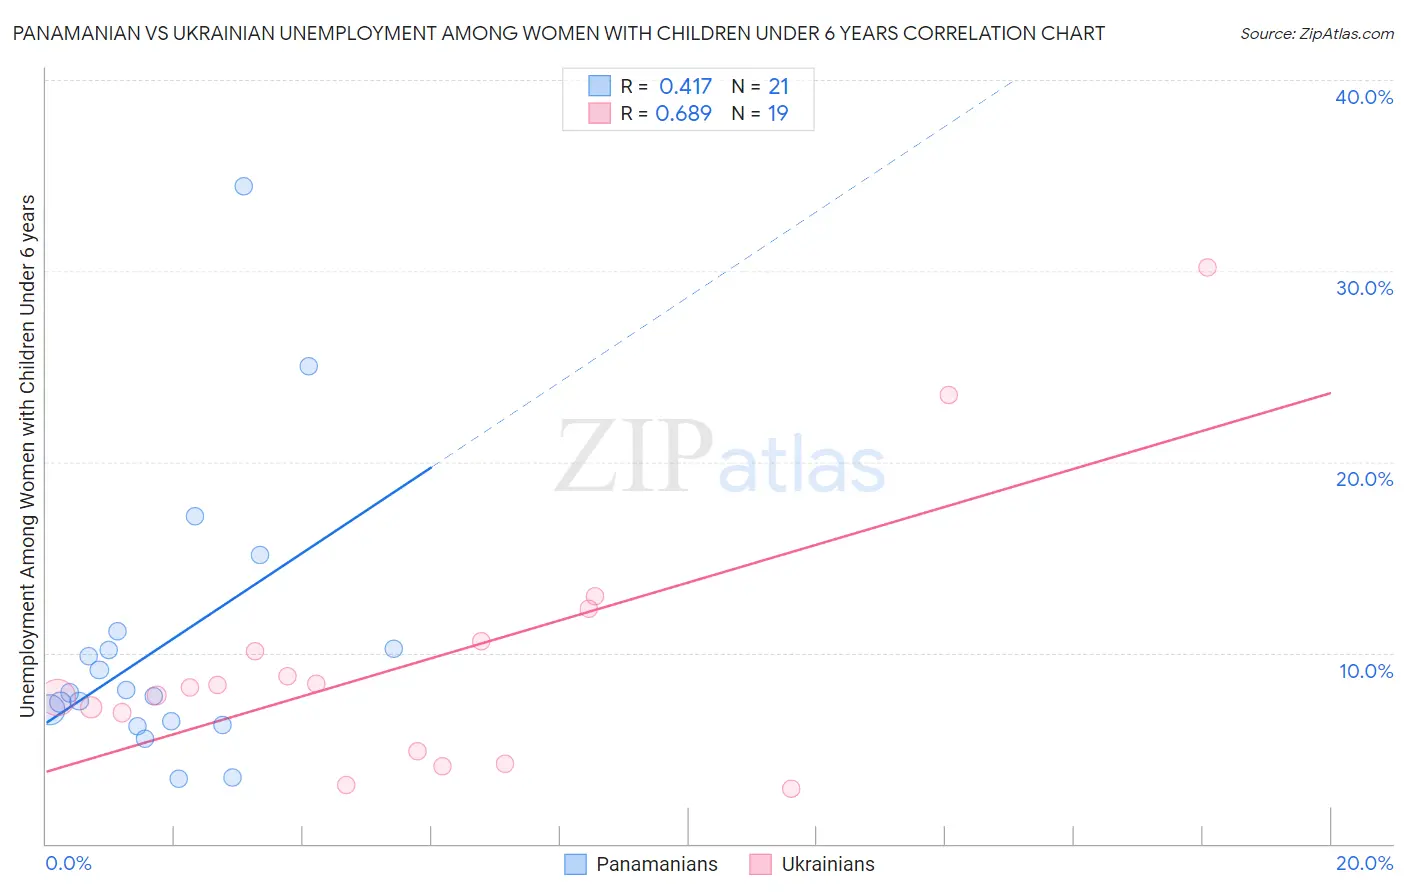
Panamanian vs Ukrainian Unemployment Among Women with Children Under 6 years Correlation Chart

The statistical analysis conducted on geographies consisting of 233,067,196 people shows a moderate positive correlation between the proportion of Panamanians and unemployment rate among women with children under the age of 6 in the United States with a correlation coefficient (R) of 0.417 and weighted average of 7.6%. Similarly, the statistical analysis conducted on geographies consisting of 322,354,784 people shows a significant positive correlation between the proportion of Ukrainians and unemployment rate among women with children under the age of 6 in the United States with a correlation coefficient (R) of 0.689 and weighted average of 7.4%, a difference of 3.5%.
Panamanian vs Ukrainian Unemployment Among Women with Children Under 6 years

Unemployment Among Women with Children Under 6 years Correlation Summary

MeasurementPanamanianUkrainian
Minimum3.4%2.9%
Maximum34.5%30.2%
Range31.0%27.3%
Mean10.4%9.6%
Median7.9%8.2%
Interquartile 25% (IQ1)6.3%4.8%
Interquartile 75% (IQ3)10.7%10.6%
Interquartile Range (IQR)4.4%5.8%
Standard Deviation (Sample)7.4%6.8%
Standard Deviation (Population)7.2%6.6%

Similar Demographics by Unemployment Among Women with Children Under 6 years

Demographics Similar to Panamanians by Unemployment Among Women with Children Under 6 years

In terms of unemployment among women with children under 6 years, the demographic groups most similar to Panamanians are Immigrants from Laos (7.6%, a difference of 0.020%), Cree (7.6%, a difference of 0.13%), Puget Sound Salish (7.7%, a difference of 0.13%), Austrian (7.7%, a difference of 0.24%), and Immigrants from England (7.7%, a difference of 0.28%).
DemographicsRating | RankUnemployment Among Women with Children Under 6 years
Immigrants | Canada
61.6
/100
|
#168
Good
7.6%
Immigrants | Scotland
61.3
/100
|
#169
Good
7.6%
Czechs
59.8
/100
|
#170
Average
7.6%
Immigrants | Grenada
59.0
/100
|
#171
Average
7.6%
Immigrants | North America
57.7
/100
|
#172
Average
7.6%
Cree
51.6
/100
|
#173
Average
7.6%
Immigrants | Laos
50.0
/100
|
#174
Average
7.6%
Panamanians
49.6
/100
|
#175
Average
7.6%
Puget Sound Salish
47.7
/100
|
#176
Average
7.7%
Austrians
46.0
/100
|
#177
Average
7.7%
Immigrants | England
45.4
/100
|
#178
Average
7.7%
Immigrants | Western Europe
44.9
/100
|
#179
Average
7.7%
Immigrants | Uruguay
44.5
/100
|
#180
Average
7.7%
Brazilians
43.9
/100
|
#181
Average
7.7%
Nepalese
43.5
/100
|
#182
Average
7.7%

Demographics Similar to Ukrainians by Unemployment Among Women with Children Under 6 years

In terms of unemployment among women with children under 6 years, the demographic groups most similar to Ukrainians are Swedish (7.4%, a difference of 0.040%), Immigrants from Armenia (7.4%, a difference of 0.13%), Slovene (7.4%, a difference of 0.17%), Immigrants from Uganda (7.4%, a difference of 0.25%), and Immigrants from Bolivia (7.4%, a difference of 0.37%).
DemographicsRating | RankUnemployment Among Women with Children Under 6 years
Immigrants | South Africa
92.5
/100
|
#124
Exceptional
7.3%
Pakistanis
92.2
/100
|
#125
Exceptional
7.3%
Immigrants | Burma/Myanmar
91.9
/100
|
#126
Exceptional
7.3%
Jordanians
91.5
/100
|
#127
Exceptional
7.3%
Zimbabweans
91.5
/100
|
#128
Exceptional
7.3%
Slovenes
89.2
/100
|
#129
Excellent
7.4%
Swedes
88.4
/100
|
#130
Excellent
7.4%
Ukrainians
88.2
/100
|
#131
Excellent
7.4%
Immigrants | Armenia
87.4
/100
|
#132
Excellent
7.4%
Immigrants | Uganda
86.5
/100
|
#133
Excellent
7.4%
Immigrants | Bolivia
85.7
/100
|
#134
Excellent
7.4%
Immigrants | Northern Africa
85.3
/100
|
#135
Excellent
7.4%
Immigrants | Morocco
84.9
/100
|
#136
Excellent
7.4%
Immigrants | Cambodia
84.6
/100
|
#137
Excellent
7.4%
Immigrants | Norway
84.1
/100
|
#138
Excellent
7.4%