Pakistani vs Immigrants from St. Vincent and the Grenadines Unemployment Among Ages 16 to 19 years
COMPARE
Pakistani
Immigrants from St. Vincent and the Grenadines
Unemployment Among Ages 16 to 19 years
Unemployment Among Ages 16 to 19 years Comparison
Pakistanis
Immigrants from St. Vincent and the Grenadines
17.2%
UNEMPLOYMENT AMONG AGES 16 TO 19 YEARS
85.8/ 100
METRIC RATING
127th/ 347
METRIC RANK
25.7%
UNEMPLOYMENT AMONG AGES 16 TO 19 YEARS
0.0/ 100
METRIC RATING
338th/ 347
METRIC RANK
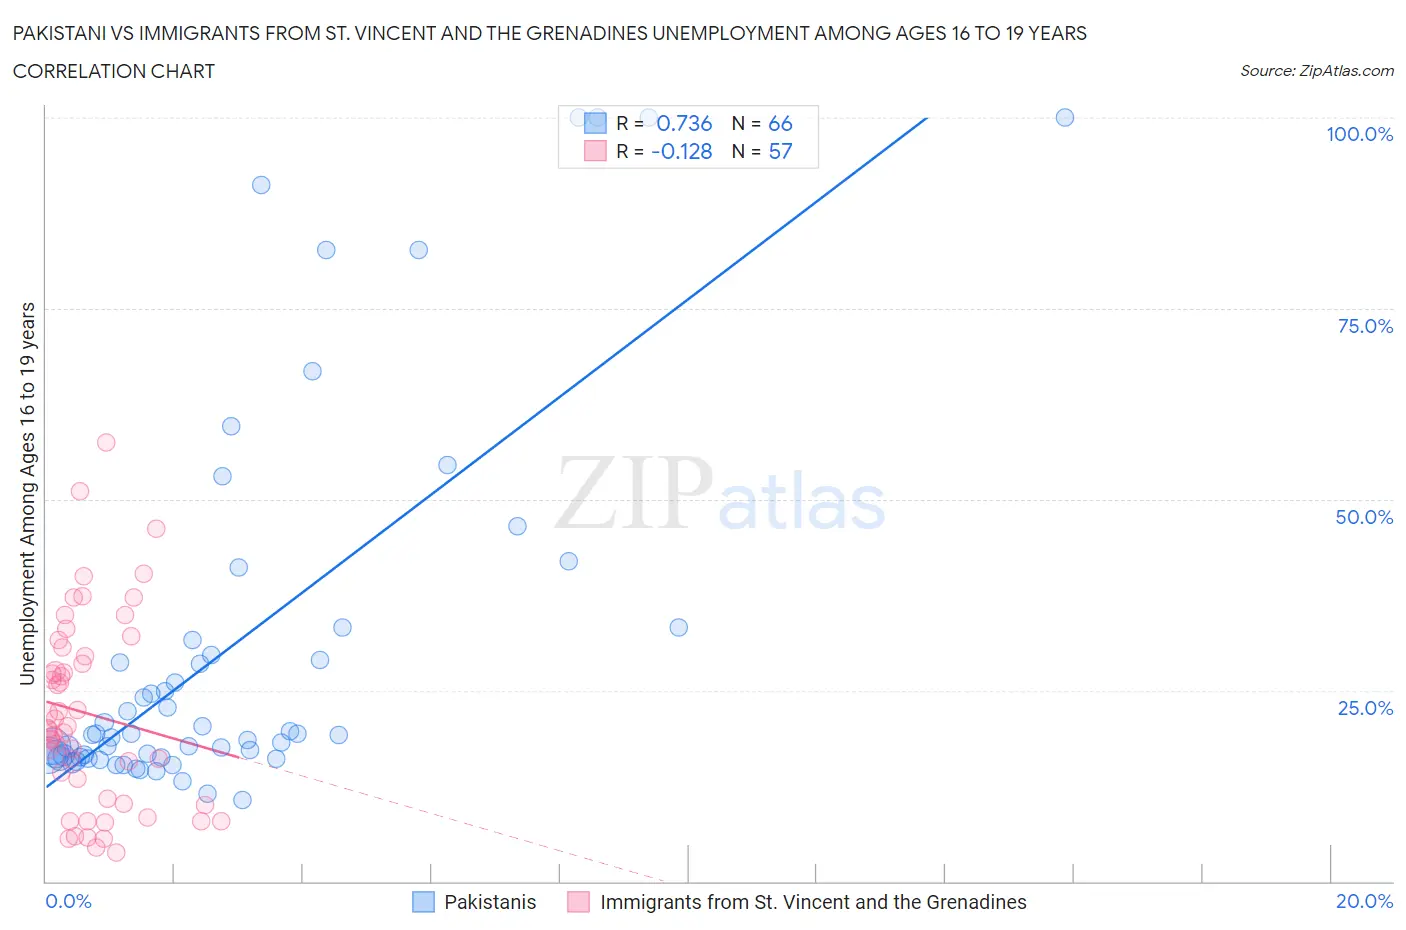
Pakistani vs Immigrants from St. Vincent and the Grenadines Unemployment Among Ages 16 to 19 years Correlation Chart
The statistical analysis conducted on geographies consisting of 322,866,087 people shows a strong positive correlation between the proportion of Pakistanis and unemployment rate among population between the ages 16 and 19 in the United States with a correlation coefficient (R) of 0.736 and weighted average of 17.2%. Similarly, the statistical analysis conducted on geographies consisting of 55,670,262 people shows a poor negative correlation between the proportion of Immigrants from St. Vincent and the Grenadines and unemployment rate among population between the ages 16 and 19 in the United States with a correlation coefficient (R) of -0.128 and weighted average of 25.7%, a difference of 49.3%.
Unemployment Among Ages 16 to 19 years Correlation Summary
| Measurement | Pakistani | Immigrants from St. Vincent and the Grenadines |
| Minimum | 10.7% | 3.8% |
| Maximum | 100.0% | 57.4% |
| Range | 89.3% | 53.6% |
| Mean | 30.8% | 21.9% |
| Median | 19.2% | 20.0% |
| Interquartile 25% (IQ1) | 16.3% | 10.4% |
| Interquartile 75% (IQ3) | 31.6% | 30.1% |
| Interquartile Range (IQR) | 15.3% | 19.6% |
| Standard Deviation (Sample) | 24.8% | 12.4% |
| Standard Deviation (Population) | 24.6% | 12.3% |
Similar Demographics by Unemployment Among Ages 16 to 19 years
Demographics Similar to Pakistanis by Unemployment Among Ages 16 to 19 years
In terms of unemployment among ages 16 to 19 years, the demographic groups most similar to Pakistanis are Australian (17.2%, a difference of 0.020%), Creek (17.2%, a difference of 0.030%), Immigrants from Bolivia (17.2%, a difference of 0.10%), Immigrants from Indonesia (17.2%, a difference of 0.10%), and German Russian (17.2%, a difference of 0.16%).
| Demographics | Rating | Rank | Unemployment Among Ages 16 to 19 years |
| Immigrants | Middle Africa | 90.9 /100 | #120 | Exceptional 17.1% |
| Immigrants | Moldova | 90.7 /100 | #121 | Exceptional 17.1% |
| Immigrants | South Eastern Asia | 90.7 /100 | #122 | Exceptional 17.1% |
| Immigrants | Laos | 88.8 /100 | #123 | Excellent 17.1% |
| Syrians | 88.6 /100 | #124 | Excellent 17.1% |
| Immigrants | Germany | 87.7 /100 | #125 | Excellent 17.2% |
| Immigrants | Bolivia | 86.7 /100 | #126 | Excellent 17.2% |
| Pakistanis | 85.8 /100 | #127 | Excellent 17.2% |
| Australians | 85.6 /100 | #128 | Excellent 17.2% |
| Creek | 85.5 /100 | #129 | Excellent 17.2% |
| Immigrants | Indonesia | 84.7 /100 | #130 | Excellent 17.2% |
| German Russians | 84.1 /100 | #131 | Excellent 17.2% |
| Arabs | 83.9 /100 | #132 | Excellent 17.2% |
| Laotians | 83.9 /100 | #133 | Excellent 17.2% |
| Potawatomi | 83.8 /100 | #134 | Excellent 17.2% |
Demographics Similar to Immigrants from St. Vincent and the Grenadines by Unemployment Among Ages 16 to 19 years
In terms of unemployment among ages 16 to 19 years, the demographic groups most similar to Immigrants from St. Vincent and the Grenadines are Immigrants from Grenada (25.7%, a difference of 0.19%), Immigrants from Guyana (25.5%, a difference of 0.81%), Kiowa (25.2%, a difference of 1.9%), Crow (26.2%, a difference of 2.1%), and Arapaho (25.2%, a difference of 2.1%).
| Demographics | Rating | Rank | Unemployment Among Ages 16 to 19 years |
| British West Indians | 0.0 /100 | #331 | Tragic 24.0% |
| Immigrants | Barbados | 0.0 /100 | #332 | Tragic 24.0% |
| Paiute | 0.0 /100 | #333 | Tragic 24.4% |
| Guyanese | 0.0 /100 | #334 | Tragic 24.8% |
| Arapaho | 0.0 /100 | #335 | Tragic 25.2% |
| Kiowa | 0.0 /100 | #336 | Tragic 25.2% |
| Immigrants | Guyana | 0.0 /100 | #337 | Tragic 25.5% |
| Immigrants | St. Vincent and the Grenadines | 0.0 /100 | #338 | Tragic 25.7% |
| Immigrants | Grenada | 0.0 /100 | #339 | Tragic 25.7% |
| Crow | 0.0 /100 | #340 | Tragic 26.2% |
| Puerto Ricans | 0.0 /100 | #341 | Tragic 27.5% |
| Inupiat | 0.0 /100 | #342 | Tragic 28.1% |
| Navajo | 0.0 /100 | #343 | Tragic 29.0% |
| Colville | 0.0 /100 | #344 | Tragic 29.7% |
| Hopi | 0.0 /100 | #345 | Tragic 30.7% |