Native/Alaskan vs Immigrants from St. Vincent and the Grenadines Unemployment Among Ages 16 to 19 years
COMPARE
Native/Alaskan
Immigrants from St. Vincent and the Grenadines
Unemployment Among Ages 16 to 19 years
Unemployment Among Ages 16 to 19 years Comparison
Natives/Alaskans
Immigrants from St. Vincent and the Grenadines
21.5%
UNEMPLOYMENT AMONG AGES 16 TO 19 YEARS
0.0/ 100
METRIC RATING
309th/ 347
METRIC RANK
25.7%
UNEMPLOYMENT AMONG AGES 16 TO 19 YEARS
0.0/ 100
METRIC RATING
338th/ 347
METRIC RANK
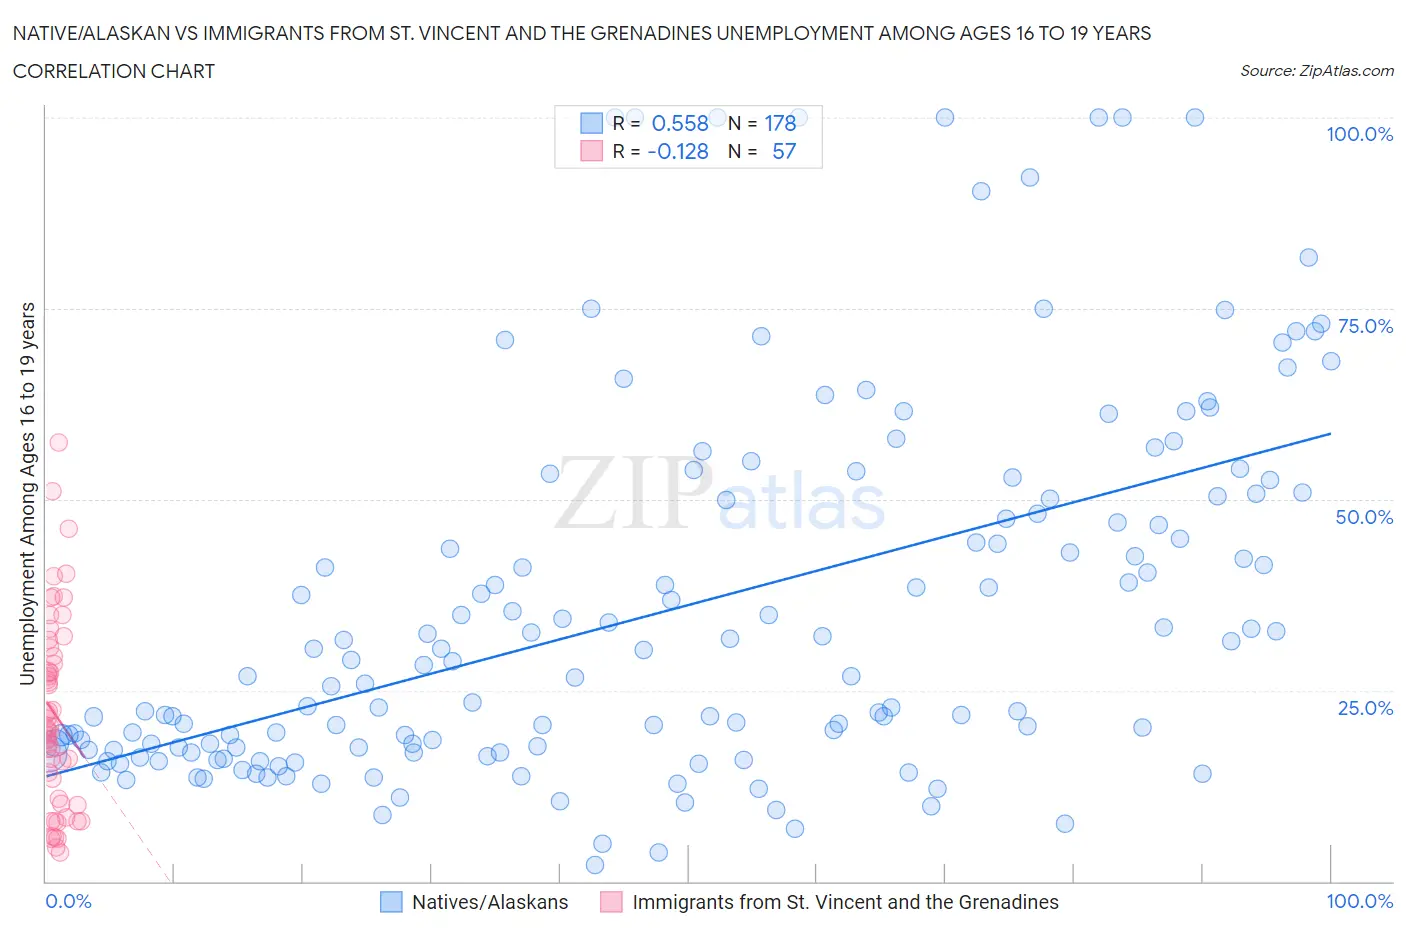
Native/Alaskan vs Immigrants from St. Vincent and the Grenadines Unemployment Among Ages 16 to 19 years Correlation Chart
The statistical analysis conducted on geographies consisting of 472,983,202 people shows a substantial positive correlation between the proportion of Natives/Alaskans and unemployment rate among population between the ages 16 and 19 in the United States with a correlation coefficient (R) of 0.558 and weighted average of 21.5%. Similarly, the statistical analysis conducted on geographies consisting of 55,670,262 people shows a poor negative correlation between the proportion of Immigrants from St. Vincent and the Grenadines and unemployment rate among population between the ages 16 and 19 in the United States with a correlation coefficient (R) of -0.128 and weighted average of 25.7%, a difference of 19.4%.
Unemployment Among Ages 16 to 19 years Correlation Summary
| Measurement | Native/Alaskan | Immigrants from St. Vincent and the Grenadines |
| Minimum | 2.2% | 3.8% |
| Maximum | 100.0% | 57.4% |
| Range | 97.8% | 53.6% |
| Mean | 35.5% | 21.9% |
| Median | 27.6% | 20.0% |
| Interquartile 25% (IQ1) | 17.3% | 10.4% |
| Interquartile 75% (IQ3) | 50.2% | 30.1% |
| Interquartile Range (IQR) | 32.9% | 19.6% |
| Standard Deviation (Sample) | 24.0% | 12.4% |
| Standard Deviation (Population) | 23.9% | 12.3% |
Similar Demographics by Unemployment Among Ages 16 to 19 years
Demographics Similar to Natives/Alaskans by Unemployment Among Ages 16 to 19 years
In terms of unemployment among ages 16 to 19 years, the demographic groups most similar to Natives/Alaskans are Vietnamese (21.5%, a difference of 0.060%), Immigrants from Bangladesh (21.5%, a difference of 0.16%), Belizean (21.6%, a difference of 0.28%), Black/African American (21.4%, a difference of 0.54%), and Houma (21.6%, a difference of 0.54%).
| Demographics | Rating | Rank | Unemployment Among Ages 16 to 19 years |
| Immigrants | Caribbean | 0.0 /100 | #302 | Tragic 20.9% |
| Senegalese | 0.0 /100 | #303 | Tragic 21.0% |
| Aleuts | 0.0 /100 | #304 | Tragic 21.2% |
| Immigrants | Senegal | 0.0 /100 | #305 | Tragic 21.2% |
| U.S. Virgin Islanders | 0.0 /100 | #306 | Tragic 21.3% |
| Blacks/African Americans | 0.0 /100 | #307 | Tragic 21.4% |
| Immigrants | Bangladesh | 0.0 /100 | #308 | Tragic 21.5% |
| Natives/Alaskans | 0.0 /100 | #309 | Tragic 21.5% |
| Vietnamese | 0.0 /100 | #310 | Tragic 21.5% |
| Belizeans | 0.0 /100 | #311 | Tragic 21.6% |
| Houma | 0.0 /100 | #312 | Tragic 21.6% |
| Jamaicans | 0.0 /100 | #313 | Tragic 21.7% |
| Alaska Natives | 0.0 /100 | #314 | Tragic 21.8% |
| Immigrants | Dominica | 0.0 /100 | #315 | Tragic 21.9% |
| Tohono O'odham | 0.0 /100 | #316 | Tragic 22.1% |
Demographics Similar to Immigrants from St. Vincent and the Grenadines by Unemployment Among Ages 16 to 19 years
In terms of unemployment among ages 16 to 19 years, the demographic groups most similar to Immigrants from St. Vincent and the Grenadines are Immigrants from Grenada (25.7%, a difference of 0.19%), Immigrants from Guyana (25.5%, a difference of 0.81%), Kiowa (25.2%, a difference of 1.9%), Crow (26.2%, a difference of 2.1%), and Arapaho (25.2%, a difference of 2.1%).
| Demographics | Rating | Rank | Unemployment Among Ages 16 to 19 years |
| British West Indians | 0.0 /100 | #331 | Tragic 24.0% |
| Immigrants | Barbados | 0.0 /100 | #332 | Tragic 24.0% |
| Paiute | 0.0 /100 | #333 | Tragic 24.4% |
| Guyanese | 0.0 /100 | #334 | Tragic 24.8% |
| Arapaho | 0.0 /100 | #335 | Tragic 25.2% |
| Kiowa | 0.0 /100 | #336 | Tragic 25.2% |
| Immigrants | Guyana | 0.0 /100 | #337 | Tragic 25.5% |
| Immigrants | St. Vincent and the Grenadines | 0.0 /100 | #338 | Tragic 25.7% |
| Immigrants | Grenada | 0.0 /100 | #339 | Tragic 25.7% |
| Crow | 0.0 /100 | #340 | Tragic 26.2% |
| Puerto Ricans | 0.0 /100 | #341 | Tragic 27.5% |
| Inupiat | 0.0 /100 | #342 | Tragic 28.1% |
| Navajo | 0.0 /100 | #343 | Tragic 29.0% |
| Colville | 0.0 /100 | #344 | Tragic 29.7% |
| Hopi | 0.0 /100 | #345 | Tragic 30.7% |