Norwegian vs Palestinian Unemployment Among Ages 45 to 54 years
COMPARE
Norwegian
Palestinian
Unemployment Among Ages 45 to 54 years
Unemployment Among Ages 45 to 54 years Comparison
Norwegians
Palestinians
3.9%
UNEMPLOYMENT AMONG AGES 45 TO 54 YEARS
100.0/ 100
METRIC RATING
3rd/ 347
METRIC RANK
4.3%
UNEMPLOYMENT AMONG AGES 45 TO 54 YEARS
98.5/ 100
METRIC RATING
71st/ 347
METRIC RANK
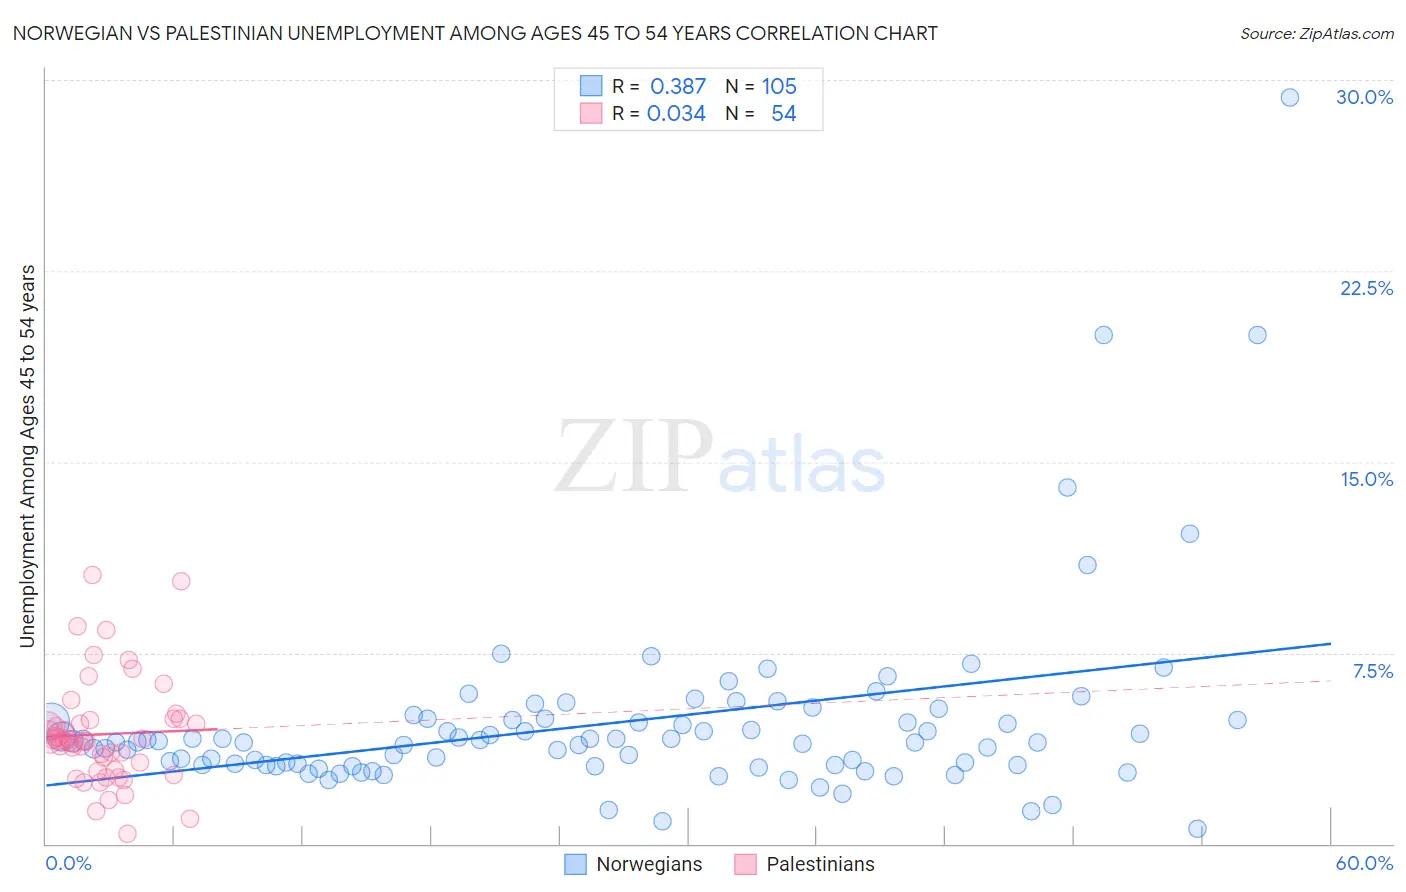
Norwegian vs Palestinian Unemployment Among Ages 45 to 54 years Correlation Chart
The statistical analysis conducted on geographies consisting of 499,828,634 people shows a mild positive correlation between the proportion of Norwegians and unemployment rate among population between the ages 45 and 54 in the United States with a correlation coefficient (R) of 0.387 and weighted average of 3.9%. Similarly, the statistical analysis conducted on geographies consisting of 214,491,183 people shows no correlation between the proportion of Palestinians and unemployment rate among population between the ages 45 and 54 in the United States with a correlation coefficient (R) of 0.034 and weighted average of 4.3%, a difference of 11.7%.
Unemployment Among Ages 45 to 54 years Correlation Summary
| Measurement | Norwegian | Palestinian |
| Minimum | 0.60% | 0.40% |
| Maximum | 29.3% | 10.6% |
| Range | 28.7% | 10.2% |
| Mean | 4.8% | 4.3% |
| Median | 4.0% | 4.0% |
| Interquartile 25% (IQ1) | 3.1% | 2.9% |
| Interquartile 75% (IQ3) | 4.9% | 4.9% |
| Interquartile Range (IQR) | 1.8% | 1.9% |
| Standard Deviation (Sample) | 3.8% | 2.1% |
| Standard Deviation (Population) | 3.8% | 2.0% |
Similar Demographics by Unemployment Among Ages 45 to 54 years
Demographics Similar to Norwegians by Unemployment Among Ages 45 to 54 years
In terms of unemployment among ages 45 to 54 years, the demographic groups most similar to Norwegians are Immigrants from India (3.9%, a difference of 0.87%), Danish (3.9%, a difference of 1.0%), Immigrants from Cuba (3.9%, a difference of 1.3%), Fijian (3.8%, a difference of 2.3%), and Immigrants from Venezuela (3.9%, a difference of 2.5%).
| Demographics | Rating | Rank | Unemployment Among Ages 45 to 54 years |
| Hmong | 100.0 /100 | #1 | Exceptional 3.7% |
| Fijians | 100.0 /100 | #2 | Exceptional 3.8% |
| Norwegians | 100.0 /100 | #3 | Exceptional 3.9% |
| Immigrants | India | 100.0 /100 | #4 | Exceptional 3.9% |
| Danes | 100.0 /100 | #5 | Exceptional 3.9% |
| Immigrants | Cuba | 100.0 /100 | #6 | Exceptional 3.9% |
| Immigrants | Venezuela | 100.0 /100 | #7 | Exceptional 3.9% |
| Chinese | 100.0 /100 | #8 | Exceptional 4.0% |
| Czechs | 100.0 /100 | #9 | Exceptional 4.0% |
| Venezuelans | 100.0 /100 | #10 | Exceptional 4.0% |
| Scandinavians | 100.0 /100 | #11 | Exceptional 4.0% |
| Swedes | 100.0 /100 | #12 | Exceptional 4.0% |
| Cubans | 100.0 /100 | #13 | Exceptional 4.0% |
| Immigrants | Bosnia and Herzegovina | 100.0 /100 | #14 | Exceptional 4.0% |
| Immigrants | Bolivia | 100.0 /100 | #15 | Exceptional 4.0% |
Demographics Similar to Palestinians by Unemployment Among Ages 45 to 54 years
In terms of unemployment among ages 45 to 54 years, the demographic groups most similar to Palestinians are White/Caucasian (4.3%, a difference of 0.030%), Paraguayan (4.3%, a difference of 0.080%), Canadian (4.3%, a difference of 0.20%), Immigrants from Belgium (4.3%, a difference of 0.21%), and Immigrants from Japan (4.3%, a difference of 0.22%).
| Demographics | Rating | Rank | Unemployment Among Ages 45 to 54 years |
| Austrians | 99.0 /100 | #64 | Exceptional 4.3% |
| Immigrants | Sudan | 99.0 /100 | #65 | Exceptional 4.3% |
| Turks | 98.9 /100 | #66 | Exceptional 4.3% |
| Immigrants | Nepal | 98.9 /100 | #67 | Exceptional 4.3% |
| Slovaks | 98.8 /100 | #68 | Exceptional 4.3% |
| Immigrants | Japan | 98.7 /100 | #69 | Exceptional 4.3% |
| Paraguayans | 98.6 /100 | #70 | Exceptional 4.3% |
| Palestinians | 98.5 /100 | #71 | Exceptional 4.3% |
| Whites/Caucasians | 98.4 /100 | #72 | Exceptional 4.3% |
| Canadians | 98.2 /100 | #73 | Exceptional 4.3% |
| Immigrants | Belgium | 98.2 /100 | #74 | Exceptional 4.3% |
| Kenyans | 98.1 /100 | #75 | Exceptional 4.3% |
| Slavs | 98.1 /100 | #76 | Exceptional 4.3% |
| Chileans | 98.1 /100 | #77 | Exceptional 4.3% |
| German Russians | 97.9 /100 | #78 | Exceptional 4.3% |