Immigrants from Middle Africa vs Palestinian Unemployment Among Ages 45 to 54 years

COMPARE

Immigrants from Middle Africa
Race
Ancestry
AfghanAfricanAlaska NativeAlaskan AthabascanAlbanianAleutAlsatianAmericanApacheArabArapahoArgentineanArmenianAssyrian/Chaldean/SyriacAustralianAustrianBahamianBangladeshiBarbadianBasqueBelgianBelizeanBermudanBhutaneseBlackfeetBolivianBrazilianBritishBritish West IndianBulgarianBurmeseCajunCambodianCanadianCape VerdeanCarpatho RusynCelticCentral AmericanCentral American IndianCherokeeCheyenneChickasawChileanChineseChippewaChoctawColombianColvilleComancheCosta RicanCreeCreekCroatianCrowCubanCypriotCzechCzechoslovakianDanishDelawareDominicanDutchDutch West IndianEastern EuropeanEcuadorianEgyptianEnglishEstonianEthiopianEuropeanFijianFilipinoFinnishFrenchFrench American IndianFrench CanadianGermanGerman RussianGhanaianGreekGuamanian/ChamorroGuatemalanGuyaneseHaitianHmongHonduranHopiHoumaHungarianIcelanderIndian (Asian)IndonesianInupiatIranianIraqiIrishIroquoisIsraeliItalianJamaicanJapaneseJordanianKenyanKiowaKoreanLaotianLatvianLebaneseLiberianLithuanianLumbeeLuxembourgerMacedonianMalaysianMalteseMarshalleseMenomineeMexicanMexican American IndianMongolianMoroccanNative HawaiianNavajoNepaleseNew ZealanderNicaraguanNigerianNorthern EuropeanNorwegianOkinawanOsageOttawaPaiutePakistaniPanamanianParaguayanPennsylvania GermanPeruvianPimaPolishPortuguesePotawatomiPuebloPuerto RicanPuget Sound SalishRomanianRussianSalvadoranSamoanScandinavianScotch-IrishScottishSeminoleSenegaleseSerbianShoshoneSierra LeoneanSiouxSlavicSlovakSloveneSomaliSouth AfricanSouth AmericanSouth American IndianSoviet UnionSpaniardSpanishSpanish AmericanSpanish American IndianSri LankanSubsaharan AfricanSudaneseSwedishSwissSyrianTaiwaneseThaiTlingit-HaidaTohono O'OdhamTonganTrinidadian and TobagonianTsimshianTurkishU.S. Virgin IslanderUgandanUkrainianUruguayanUteVenezuelanVietnameseWelshWest IndianYakamaYaquiYugoslavianYumanYup'ikZimbabwean
Immigration
NonimmigrantsImmigrantsAfghanistanAfricaAlbaniaArgentinaArmeniaAsiaAustraliaAustriaBahamasBangladeshBarbadosBelarusBelgiumBelizeBoliviaBosnia and HerzegovinaBrazilBulgariaBurma/MyanmarCabo VerdeCambodiaCameroonCanadaCaribbeanCentral AmericaChileChinaColombiaCongoCosta RicaCroatiaCubaCzechoslovakiaDenmarkDominicaDominican RepublicEastern AfricaEastern AsiaEastern EuropeEcuadorEgyptEl SalvadorEnglandEritreaEthiopiaEuropeFijiFranceGermanyGhanaGreeceGrenadaGuatemalaGuyanaHaitiHondurasHong KongHungaryIndiaIndonesiaIranIraqIrelandIsraelItalyJamaicaJapanJordanKazakhstanKenyaKoreaKuwaitLaosLatin AmericaLatviaLebanonLiberiaLithuaniaMalaysiaMexicoMicronesiaMiddle AfricaMoldovaMoroccoNepalNetherlandsNicaraguaNigeriaNorth AmericaNorth MacedoniaNorthern AfricaNorthern EuropeNorwayOceaniaPakistanPanamaPeruPhilippinesPolandPortugalRomaniaRussiaSaudi ArabiaScotlandSenegalSerbiaSierra LeoneSingaporeSomaliaSouth AfricaSouth AmericaSouth Central AsiaSouth Eastern AsiaSouthern EuropeSpainSri LankaSt. Vincent and the GrenadinesSudanSwedenSwitzerlandSyriaTaiwanThailandTrinidad and TobagoTurkeyUgandaUkraineUruguayUzbekistanVenezuelaVietnamWest IndiesWestern AfricaWestern AsiaWestern EuropeYemenZaireZimbabweAzores
Palestinian
Race
Ancestry
AfghanAfricanAlaska NativeAlaskan AthabascanAlbanianAleutAlsatianAmericanApacheArabArapahoArgentineanArmenianAssyrian/Chaldean/SyriacAustralianAustrianBahamianBangladeshiBarbadianBasqueBelgianBelizeanBermudanBhutaneseBlackfeetBolivianBrazilianBritishBritish West IndianBulgarianBurmeseCajunCambodianCanadianCape VerdeanCarpatho RusynCelticCentral AmericanCentral American IndianCherokeeCheyenneChickasawChileanChineseChippewaChoctawColombianColvilleComancheCosta RicanCreeCreekCroatianCrowCubanCypriotCzechCzechoslovakianDanishDelawareDominicanDutchDutch West IndianEastern EuropeanEcuadorianEgyptianEnglishEstonianEthiopianEuropeanFijianFilipinoFinnishFrenchFrench American IndianFrench CanadianGermanGerman RussianGhanaianGreekGuamanian/ChamorroGuatemalanGuyaneseHaitianHmongHonduranHopiHoumaHungarianIcelanderIndian (Asian)IndonesianInupiatIranianIraqiIrishIroquoisIsraeliItalianJamaicanJapaneseJordanianKenyanKiowaKoreanLaotianLatvianLebaneseLiberianLithuanianLumbeeLuxembourgerMacedonianMalaysianMalteseMarshalleseMenomineeMexicanMexican American IndianMongolianMoroccanNative HawaiianNavajoNepaleseNew ZealanderNicaraguanNigerianNorthern EuropeanNorwegianOkinawanOsageOttawaPaiutePakistaniPalestinianPanamanianParaguayanPennsylvania GermanPeruvianPimaPolishPortuguesePotawatomiPuebloPuerto RicanPuget Sound SalishRomanianRussianSalvadoranSamoanScandinavianScotch-IrishScottishSeminoleSenegaleseSerbianShoshoneSierra LeoneanSiouxSlavicSlovakSloveneSomaliSouth AfricanSouth AmericanSouth American IndianSoviet UnionSpaniardSpanishSpanish AmericanSpanish American IndianSri LankanSubsaharan AfricanSudaneseSwedishSwissSyrianTaiwaneseThaiTlingit-HaidaTohono O'OdhamTonganTrinidadian and TobagonianTsimshianTurkishU.S. Virgin IslanderUgandanUkrainianUruguayanUteVenezuelanVietnameseWelshWest IndianYakamaYaquiYugoslavianYumanYup'ikZimbabwean
Immigration
NonimmigrantsImmigrantsAfghanistanAfricaAlbaniaArgentinaArmeniaAsiaAustraliaAustriaBahamasBangladeshBarbadosBelarusBelgiumBelizeBoliviaBosnia and HerzegovinaBrazilBulgariaBurma/MyanmarCabo VerdeCambodiaCameroonCanadaCaribbeanCentral AmericaChileChinaColombiaCongoCosta RicaCroatiaCubaCzechoslovakiaDenmarkDominicaDominican RepublicEastern AfricaEastern AsiaEastern EuropeEcuadorEgyptEl SalvadorEnglandEritreaEthiopiaEuropeFijiFranceGermanyGhanaGreeceGrenadaGuatemalaGuyanaHaitiHondurasHong KongHungaryIndiaIndonesiaIranIraqIrelandIsraelItalyJamaicaJapanJordanKazakhstanKenyaKoreaKuwaitLaosLatin AmericaLatviaLebanonLiberiaLithuaniaMalaysiaMexicoMicronesiaMoldovaMoroccoNepalNetherlandsNicaraguaNigeriaNorth AmericaNorth MacedoniaNorthern AfricaNorthern EuropeNorwayOceaniaPakistanPanamaPeruPhilippinesPolandPortugalRomaniaRussiaSaudi ArabiaScotlandSenegalSerbiaSierra LeoneSingaporeSomaliaSouth AfricaSouth AmericaSouth Central AsiaSouth Eastern AsiaSouthern EuropeSpainSri LankaSt. Vincent and the GrenadinesSudanSwedenSwitzerlandSyriaTaiwanThailandTrinidad and TobagoTurkeyUgandaUkraineUruguayUzbekistanVenezuelaVietnamWest IndiesWestern AfricaWestern AsiaWestern EuropeYemenZaireZimbabweAzores
Unemployment Among Ages 45 to 54 years
Income
Poverty
Unemployment
Labor Participation
Family Structure
Vehicle Availability
Education Level
Disability

Unemployment Among Ages 45 to 54 years Comparison

Immigrants from Middle Africa

Palestinians

Excellent
Exceptional
4.4%
UNEMPLOYMENT AMONG AGES 45 TO 54 YEARS
83.3/ 100
METRIC RATING
136th/ 347
METRIC RANK
4.3%
UNEMPLOYMENT AMONG AGES 45 TO 54 YEARS
98.5/ 100
METRIC RATING
71st/ 347
METRIC RANK

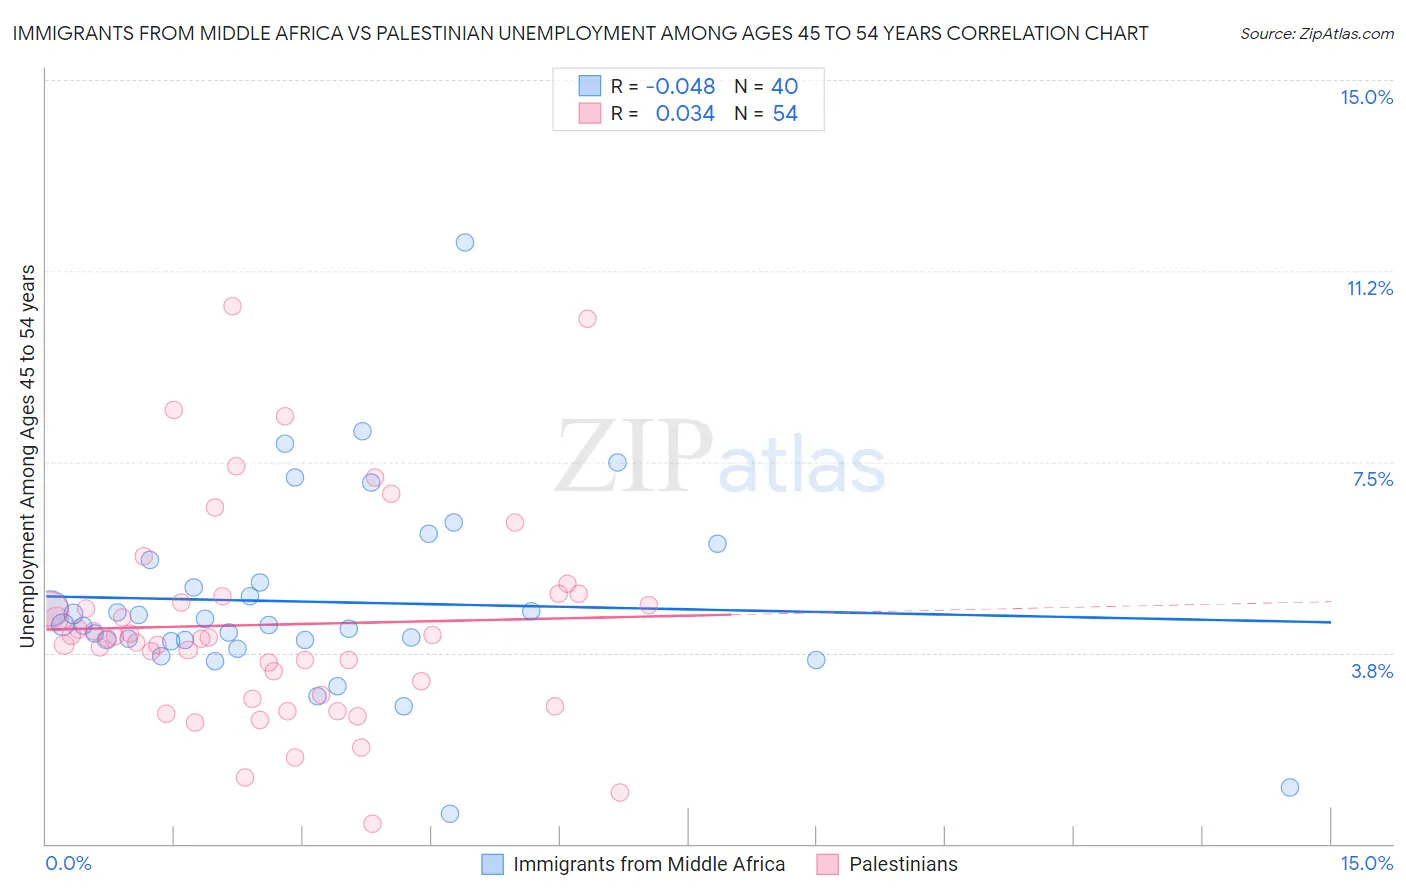
Immigrants from Middle Africa vs Palestinian Unemployment Among Ages 45 to 54 years Correlation Chart

The statistical analysis conducted on geographies consisting of 200,641,916 people shows no correlation between the proportion of Immigrants from Middle Africa and unemployment rate among population between the ages 45 and 54 in the United States with a correlation coefficient (R) of -0.048 and weighted average of 4.4%. Similarly, the statistical analysis conducted on geographies consisting of 214,491,183 people shows no correlation between the proportion of Palestinians and unemployment rate among population between the ages 45 and 54 in the United States with a correlation coefficient (R) of 0.034 and weighted average of 4.3%, a difference of 3.1%.
Immigrants from Middle Africa vs Palestinian Unemployment Among Ages 45 to 54 years

Unemployment Among Ages 45 to 54 years Correlation Summary

MeasurementImmigrants from Middle AfricaPalestinian
Minimum0.60%0.40%
Maximum11.8%10.6%
Range11.2%10.2%
Mean4.8%4.3%
Median4.3%4.0%
Interquartile 25% (IQ1)4.0%2.9%
Interquartile 75% (IQ3)5.3%4.9%
Interquartile Range (IQR)1.4%1.9%
Standard Deviation (Sample)1.9%2.1%
Standard Deviation (Population)1.9%2.0%

Similar Demographics by Unemployment Among Ages 45 to 54 years

Demographics Similar to Immigrants from Middle Africa by Unemployment Among Ages 45 to 54 years

In terms of unemployment among ages 45 to 54 years, the demographic groups most similar to Immigrants from Middle Africa are Immigrants from Eastern Asia (4.4%, a difference of 0.060%), Afghan (4.4%, a difference of 0.11%), Lebanese (4.4%, a difference of 0.12%), Immigrants from Cameroon (4.4%, a difference of 0.13%), and Immigrants from Congo (4.4%, a difference of 0.13%).
DemographicsRating | RankUnemployment Among Ages 45 to 54 years
Laotians
86.3
/100
|
#129
Excellent
4.4%
Celtics
86.2
/100
|
#130
Excellent
4.4%
Immigrants | Germany
85.9
/100
|
#131
Excellent
4.4%
Immigrants | Eastern Africa
85.1
/100
|
#132
Excellent
4.4%
Immigrants | Cameroon
84.8
/100
|
#133
Excellent
4.4%
Afghans
84.6
/100
|
#134
Excellent
4.4%
Immigrants | Eastern Asia
84.0
/100
|
#135
Excellent
4.4%
Immigrants | Middle Africa
83.3
/100
|
#136
Excellent
4.4%
Lebanese
81.9
/100
|
#137
Excellent
4.4%
Immigrants | Congo
81.8
/100
|
#138
Excellent
4.4%
Immigrants | Kuwait
81.7
/100
|
#139
Excellent
4.4%
Immigrants | Zaire
80.7
/100
|
#140
Excellent
4.4%
Immigrants | Afghanistan
79.6
/100
|
#141
Good
4.4%
Immigrants | Netherlands
79.4
/100
|
#142
Good
4.4%
Macedonians
79.0
/100
|
#143
Good
4.5%

Demographics Similar to Palestinians by Unemployment Among Ages 45 to 54 years

In terms of unemployment among ages 45 to 54 years, the demographic groups most similar to Palestinians are White/Caucasian (4.3%, a difference of 0.030%), Paraguayan (4.3%, a difference of 0.080%), Canadian (4.3%, a difference of 0.20%), Immigrants from Belgium (4.3%, a difference of 0.21%), and Immigrants from Japan (4.3%, a difference of 0.22%).
DemographicsRating | RankUnemployment Among Ages 45 to 54 years
Austrians
99.0
/100
|
#64
Exceptional
4.3%
Immigrants | Sudan
99.0
/100
|
#65
Exceptional
4.3%
Turks
98.9
/100
|
#66
Exceptional
4.3%
Immigrants | Nepal
98.9
/100
|
#67
Exceptional
4.3%
Slovaks
98.8
/100
|
#68
Exceptional
4.3%
Immigrants | Japan
98.7
/100
|
#69
Exceptional
4.3%
Paraguayans
98.6
/100
|
#70
Exceptional
4.3%
Palestinians
98.5
/100
|
#71
Exceptional
4.3%
Whites/Caucasians
98.4
/100
|
#72
Exceptional
4.3%
Canadians
98.2
/100
|
#73
Exceptional
4.3%
Immigrants | Belgium
98.2
/100
|
#74
Exceptional
4.3%
Kenyans
98.1
/100
|
#75
Exceptional
4.3%
Slavs
98.1
/100
|
#76
Exceptional
4.3%
Chileans
98.1
/100
|
#77
Exceptional
4.3%
German Russians
97.9
/100
|
#78
Exceptional
4.3%