Nicaraguan vs Immigrants from Senegal Unemployment Among Ages 55 to 59 years
COMPARE
Nicaraguan
Immigrants from Senegal
Unemployment Among Ages 55 to 59 years
Unemployment Among Ages 55 to 59 years Comparison
Nicaraguans
Immigrants from Senegal
4.8%
UNEMPLOYMENT AMONG AGES 55 TO 59 YEARS
54.0/ 100
METRIC RATING
172nd/ 347
METRIC RANK
5.2%
UNEMPLOYMENT AMONG AGES 55 TO 59 YEARS
0.1/ 100
METRIC RATING
267th/ 347
METRIC RANK
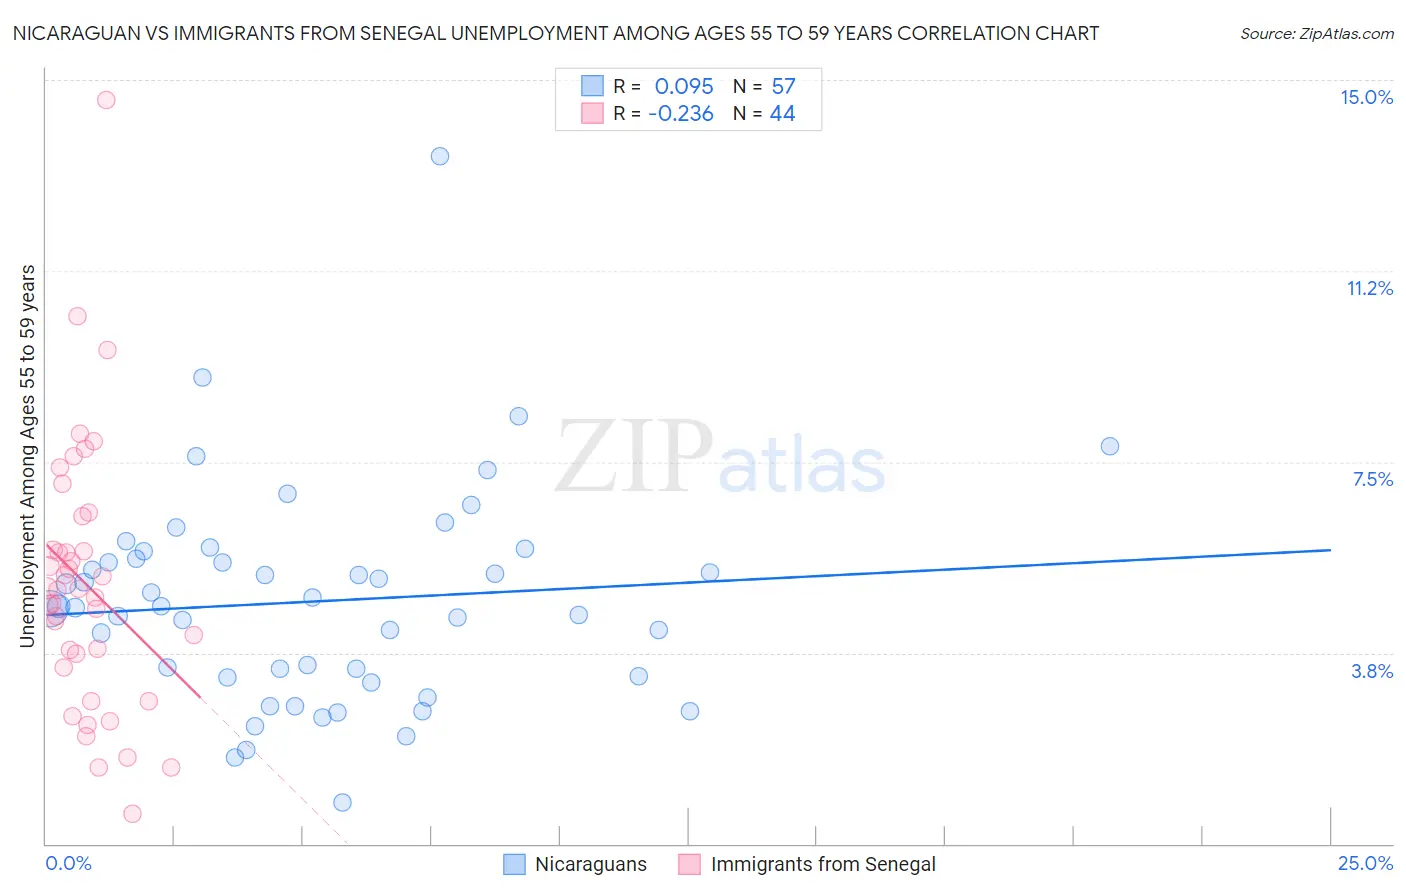
Nicaraguan vs Immigrants from Senegal Unemployment Among Ages 55 to 59 years Correlation Chart
The statistical analysis conducted on geographies consisting of 273,019,827 people shows a slight positive correlation between the proportion of Nicaraguans and unemployment rate among population between the ages 55 and 59 in the United States with a correlation coefficient (R) of 0.095 and weighted average of 4.8%. Similarly, the statistical analysis conducted on geographies consisting of 88,555,073 people shows a weak negative correlation between the proportion of Immigrants from Senegal and unemployment rate among population between the ages 55 and 59 in the United States with a correlation coefficient (R) of -0.236 and weighted average of 5.2%, a difference of 7.3%.
Unemployment Among Ages 55 to 59 years Correlation Summary
| Measurement | Nicaraguan | Immigrants from Senegal |
| Minimum | 0.80% | 0.60% |
| Maximum | 13.5% | 14.6% |
| Range | 12.7% | 14.0% |
| Mean | 4.8% | 5.1% |
| Median | 4.7% | 5.0% |
| Interquartile 25% (IQ1) | 3.3% | 3.6% |
| Interquartile 75% (IQ3) | 5.7% | 6.1% |
| Interquartile Range (IQR) | 2.4% | 2.5% |
| Standard Deviation (Sample) | 2.1% | 2.6% |
| Standard Deviation (Population) | 2.1% | 2.6% |
Similar Demographics by Unemployment Among Ages 55 to 59 years
Demographics Similar to Nicaraguans by Unemployment Among Ages 55 to 59 years
In terms of unemployment among ages 55 to 59 years, the demographic groups most similar to Nicaraguans are Japanese (4.8%, a difference of 0.020%), Uruguayan (4.8%, a difference of 0.070%), Immigrants from Eastern Europe (4.8%, a difference of 0.070%), Immigrants from Croatia (4.8%, a difference of 0.16%), and Immigrants from Sudan (4.8%, a difference of 0.18%).
| Demographics | Rating | Rank | Unemployment Among Ages 55 to 59 years |
| Immigrants | France | 62.0 /100 | #165 | Good 4.8% |
| Potawatomi | 62.0 /100 | #166 | Good 4.8% |
| Immigrants | Western Europe | 60.4 /100 | #167 | Good 4.8% |
| Immigrants | Cambodia | 59.3 /100 | #168 | Average 4.8% |
| Immigrants | Sudan | 58.4 /100 | #169 | Average 4.8% |
| Uruguayans | 55.6 /100 | #170 | Average 4.8% |
| Japanese | 54.5 /100 | #171 | Average 4.8% |
| Nicaraguans | 54.0 /100 | #172 | Average 4.8% |
| Immigrants | Eastern Europe | 52.2 /100 | #173 | Average 4.8% |
| Immigrants | Croatia | 50.0 /100 | #174 | Average 4.8% |
| Australians | 48.6 /100 | #175 | Average 4.8% |
| Samoans | 47.1 /100 | #176 | Average 4.8% |
| Immigrants | Sri Lanka | 46.8 /100 | #177 | Average 4.8% |
| Arabs | 44.7 /100 | #178 | Average 4.8% |
| Hungarians | 44.3 /100 | #179 | Average 4.8% |
Demographics Similar to Immigrants from Senegal by Unemployment Among Ages 55 to 59 years
In terms of unemployment among ages 55 to 59 years, the demographic groups most similar to Immigrants from Senegal are Jamaican (5.2%, a difference of 0.0%), Mexican (5.2%, a difference of 0.010%), Yaqui (5.2%, a difference of 0.030%), Tsimshian (5.2%, a difference of 0.030%), and Immigrants from Caribbean (5.2%, a difference of 0.090%).
| Demographics | Rating | Rank | Unemployment Among Ages 55 to 59 years |
| Immigrants | Western Africa | 0.2 /100 | #260 | Tragic 5.1% |
| Africans | 0.1 /100 | #261 | Tragic 5.1% |
| Immigrants | El Salvador | 0.1 /100 | #262 | Tragic 5.1% |
| Immigrants | Sierra Leone | 0.1 /100 | #263 | Tragic 5.2% |
| Immigrants | Caribbean | 0.1 /100 | #264 | Tragic 5.2% |
| Yaqui | 0.1 /100 | #265 | Tragic 5.2% |
| Jamaicans | 0.1 /100 | #266 | Tragic 5.2% |
| Immigrants | Senegal | 0.1 /100 | #267 | Tragic 5.2% |
| Mexicans | 0.1 /100 | #268 | Tragic 5.2% |
| Tsimshian | 0.1 /100 | #269 | Tragic 5.2% |
| Ute | 0.1 /100 | #270 | Tragic 5.2% |
| Cree | 0.1 /100 | #271 | Tragic 5.2% |
| Immigrants | Jamaica | 0.0 /100 | #272 | Tragic 5.2% |
| Ottawa | 0.0 /100 | #273 | Tragic 5.2% |
| Mexican American Indians | 0.0 /100 | #274 | Tragic 5.2% |