Nicaraguan vs Immigrants from Bolivia Unemployment Among Ages 55 to 59 years
COMPARE
Nicaraguan
Immigrants from Bolivia
Unemployment Among Ages 55 to 59 years
Unemployment Among Ages 55 to 59 years Comparison
Nicaraguans
Immigrants from Bolivia
4.8%
UNEMPLOYMENT AMONG AGES 55 TO 59 YEARS
54.0/ 100
METRIC RATING
172nd/ 347
METRIC RANK
4.2%
UNEMPLOYMENT AMONG AGES 55 TO 59 YEARS
100.0/ 100
METRIC RATING
5th/ 347
METRIC RANK
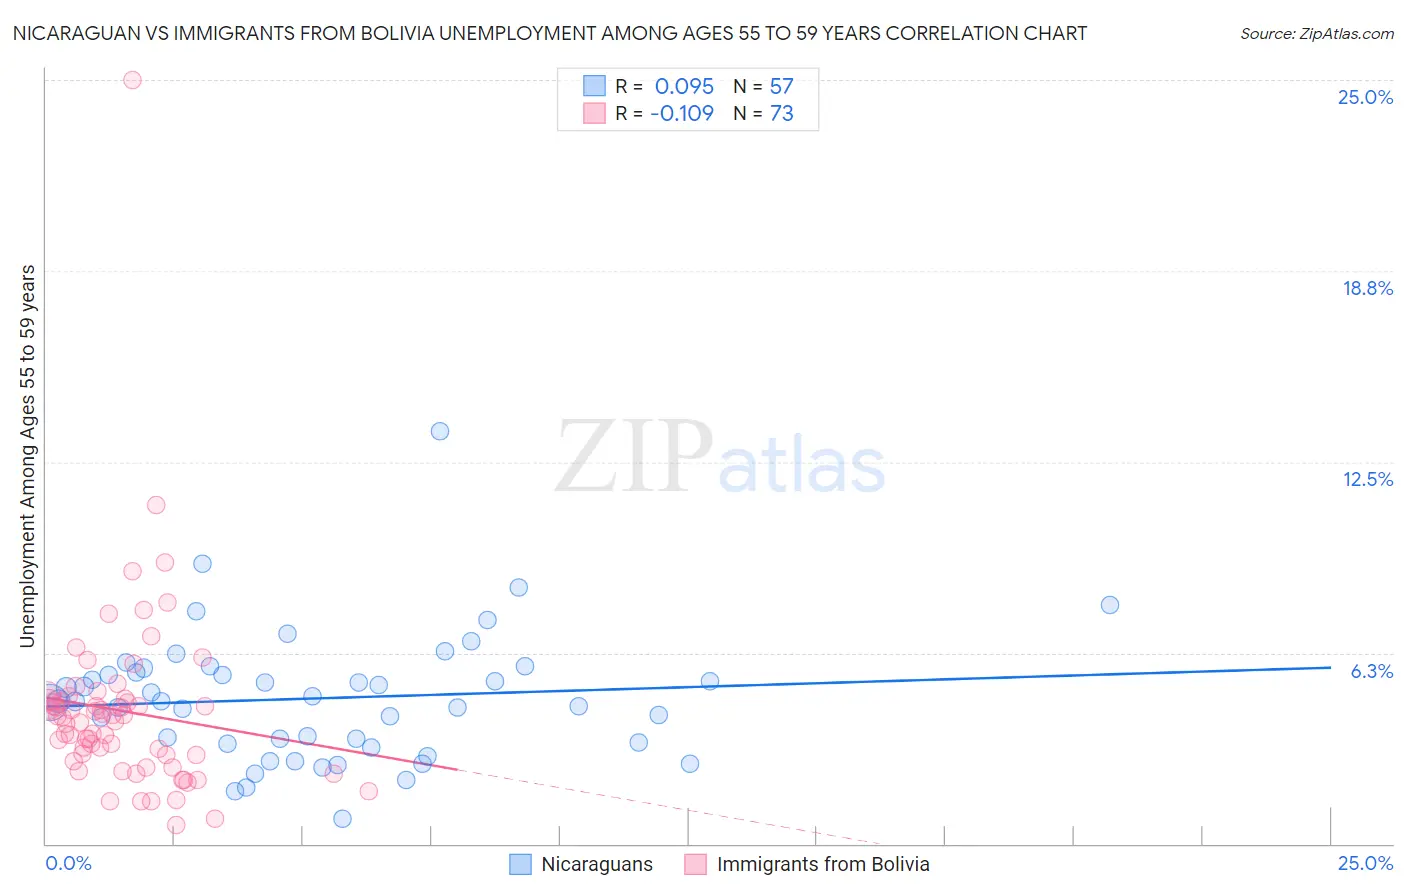
Nicaraguan vs Immigrants from Bolivia Unemployment Among Ages 55 to 59 years Correlation Chart
The statistical analysis conducted on geographies consisting of 273,019,827 people shows a slight positive correlation between the proportion of Nicaraguans and unemployment rate among population between the ages 55 and 59 in the United States with a correlation coefficient (R) of 0.095 and weighted average of 4.8%. Similarly, the statistical analysis conducted on geographies consisting of 154,662,666 people shows a poor negative correlation between the proportion of Immigrants from Bolivia and unemployment rate among population between the ages 55 and 59 in the United States with a correlation coefficient (R) of -0.109 and weighted average of 4.2%, a difference of 15.0%.
Unemployment Among Ages 55 to 59 years Correlation Summary
| Measurement | Nicaraguan | Immigrants from Bolivia |
| Minimum | 0.80% | 0.60% |
| Maximum | 13.5% | 25.0% |
| Range | 12.7% | 24.4% |
| Mean | 4.8% | 4.4% |
| Median | 4.7% | 4.1% |
| Interquartile 25% (IQ1) | 3.3% | 2.8% |
| Interquartile 75% (IQ3) | 5.7% | 4.7% |
| Interquartile Range (IQR) | 2.4% | 1.9% |
| Standard Deviation (Sample) | 2.1% | 3.1% |
| Standard Deviation (Population) | 2.1% | 3.1% |
Similar Demographics by Unemployment Among Ages 55 to 59 years
Demographics Similar to Nicaraguans by Unemployment Among Ages 55 to 59 years
In terms of unemployment among ages 55 to 59 years, the demographic groups most similar to Nicaraguans are Japanese (4.8%, a difference of 0.020%), Uruguayan (4.8%, a difference of 0.070%), Immigrants from Eastern Europe (4.8%, a difference of 0.070%), Immigrants from Croatia (4.8%, a difference of 0.16%), and Immigrants from Sudan (4.8%, a difference of 0.18%).
| Demographics | Rating | Rank | Unemployment Among Ages 55 to 59 years |
| Immigrants | France | 62.0 /100 | #165 | Good 4.8% |
| Potawatomi | 62.0 /100 | #166 | Good 4.8% |
| Immigrants | Western Europe | 60.4 /100 | #167 | Good 4.8% |
| Immigrants | Cambodia | 59.3 /100 | #168 | Average 4.8% |
| Immigrants | Sudan | 58.4 /100 | #169 | Average 4.8% |
| Uruguayans | 55.6 /100 | #170 | Average 4.8% |
| Japanese | 54.5 /100 | #171 | Average 4.8% |
| Nicaraguans | 54.0 /100 | #172 | Average 4.8% |
| Immigrants | Eastern Europe | 52.2 /100 | #173 | Average 4.8% |
| Immigrants | Croatia | 50.0 /100 | #174 | Average 4.8% |
| Australians | 48.6 /100 | #175 | Average 4.8% |
| Samoans | 47.1 /100 | #176 | Average 4.8% |
| Immigrants | Sri Lanka | 46.8 /100 | #177 | Average 4.8% |
| Arabs | 44.7 /100 | #178 | Average 4.8% |
| Hungarians | 44.3 /100 | #179 | Average 4.8% |
Demographics Similar to Immigrants from Bolivia by Unemployment Among Ages 55 to 59 years
In terms of unemployment among ages 55 to 59 years, the demographic groups most similar to Immigrants from Bolivia are Venezuelan (4.2%, a difference of 0.54%), Norwegian (4.2%, a difference of 0.58%), Zimbabwean (4.2%, a difference of 1.1%), Bolivian (4.2%, a difference of 1.3%), and Cuban (4.2%, a difference of 1.4%).
| Demographics | Rating | Rank | Unemployment Among Ages 55 to 59 years |
| Fijians | 100.0 /100 | #1 | Exceptional 4.1% |
| Immigrants | Cuba | 100.0 /100 | #2 | Exceptional 4.1% |
| Immigrants | Venezuela | 100.0 /100 | #3 | Exceptional 4.1% |
| Venezuelans | 100.0 /100 | #4 | Exceptional 4.2% |
| Immigrants | Bolivia | 100.0 /100 | #5 | Exceptional 4.2% |
| Norwegians | 100.0 /100 | #6 | Exceptional 4.2% |
| Zimbabweans | 100.0 /100 | #7 | Exceptional 4.2% |
| Bolivians | 100.0 /100 | #8 | Exceptional 4.2% |
| Cubans | 100.0 /100 | #9 | Exceptional 4.2% |
| Tongans | 100.0 /100 | #10 | Exceptional 4.3% |
| Immigrants | Congo | 100.0 /100 | #11 | Exceptional 4.3% |
| Danes | 100.0 /100 | #12 | Exceptional 4.3% |
| Indonesians | 100.0 /100 | #13 | Exceptional 4.3% |
| Immigrants | India | 100.0 /100 | #14 | Exceptional 4.3% |
| Bulgarians | 100.0 /100 | #15 | Exceptional 4.3% |