Nicaraguan vs Immigrants from Central America Unemployment Among Women with Children Under 18 years
COMPARE
Nicaraguan
Immigrants from Central America
Unemployment Among Women with Children Under 18 years
Unemployment Among Women with Children Under 18 years Comparison
Nicaraguans
Immigrants from Central America
5.6%
UNEMPLOYMENT AMONG WOMEN WITH CHILDREN UNDER 18 YEARS
12.3/ 100
METRIC RATING
206th/ 347
METRIC RANK
6.5%
UNEMPLOYMENT AMONG WOMEN WITH CHILDREN UNDER 18 YEARS
0.0/ 100
METRIC RATING
305th/ 347
METRIC RANK
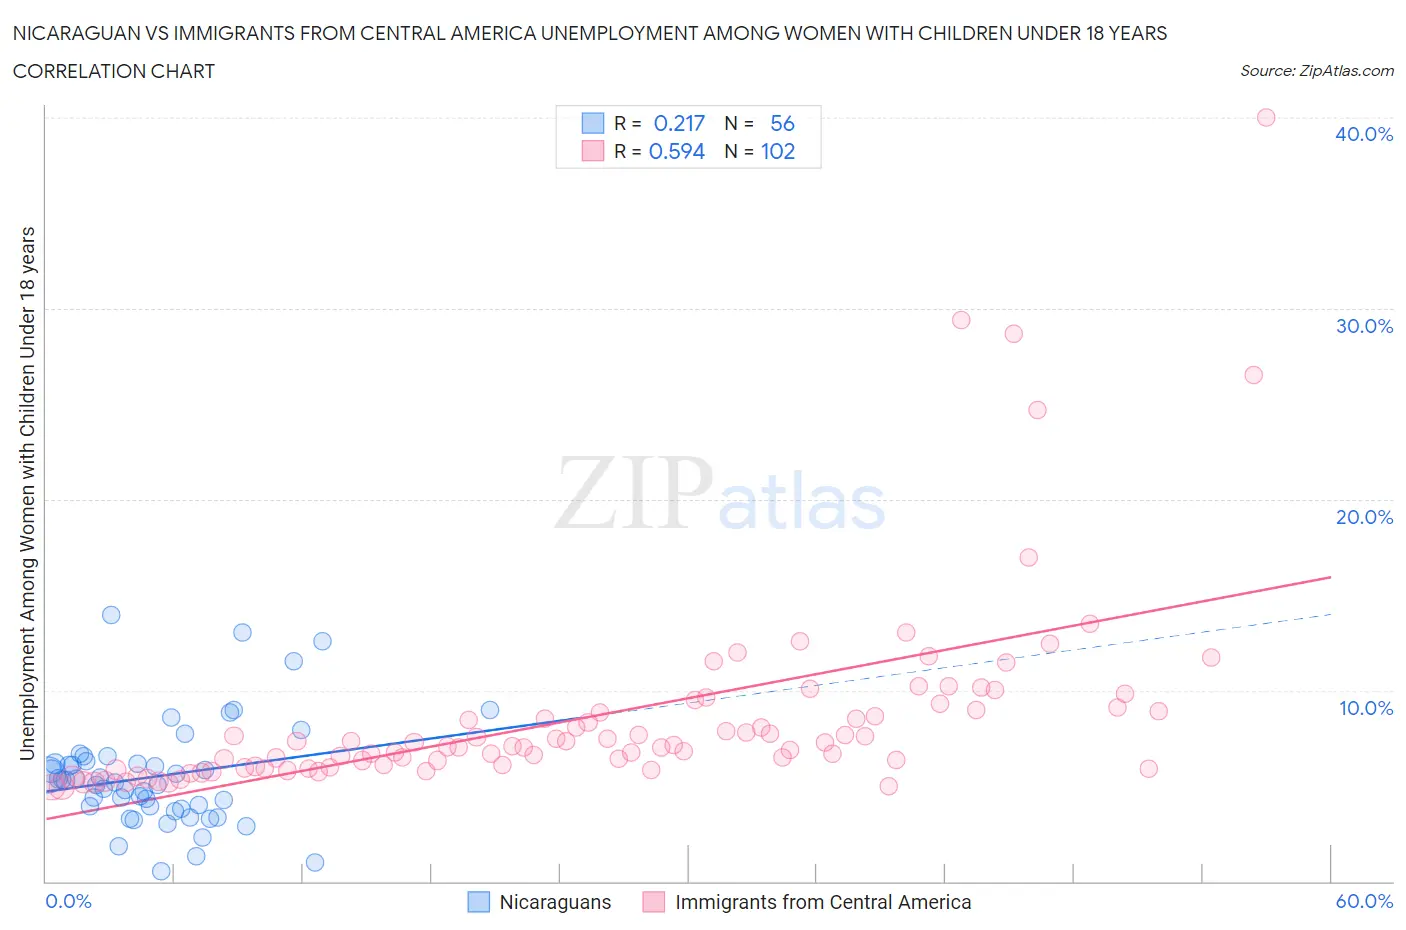
Nicaraguan vs Immigrants from Central America Unemployment Among Women with Children Under 18 years Correlation Chart
The statistical analysis conducted on geographies consisting of 280,093,302 people shows a weak positive correlation between the proportion of Nicaraguans and unemployment rate among women with children under the age of 18 in the United States with a correlation coefficient (R) of 0.217 and weighted average of 5.6%. Similarly, the statistical analysis conducted on geographies consisting of 496,300,462 people shows a substantial positive correlation between the proportion of Immigrants from Central America and unemployment rate among women with children under the age of 18 in the United States with a correlation coefficient (R) of 0.594 and weighted average of 6.5%, a difference of 15.6%.
Unemployment Among Women with Children Under 18 years Correlation Summary
| Measurement | Nicaraguan | Immigrants from Central America |
| Minimum | 0.50% | 4.9% |
| Maximum | 14.0% | 40.0% |
| Range | 13.5% | 35.1% |
| Mean | 5.5% | 8.7% |
| Median | 5.2% | 7.1% |
| Interquartile 25% (IQ1) | 3.9% | 5.9% |
| Interquartile 75% (IQ3) | 6.2% | 9.0% |
| Interquartile Range (IQR) | 2.4% | 3.0% |
| Standard Deviation (Sample) | 2.8% | 5.4% |
| Standard Deviation (Population) | 2.7% | 5.4% |
Similar Demographics by Unemployment Among Women with Children Under 18 years
Demographics Similar to Nicaraguans by Unemployment Among Women with Children Under 18 years
In terms of unemployment among women with children under 18 years, the demographic groups most similar to Nicaraguans are Peruvian (5.6%, a difference of 0.040%), Immigrants from Costa Rica (5.6%, a difference of 0.12%), Immigrants from Western Asia (5.6%, a difference of 0.18%), Nonimmigrants (5.7%, a difference of 0.29%), and Panamanian (5.7%, a difference of 0.39%).
| Demographics | Rating | Rank | Unemployment Among Women with Children Under 18 years |
| Marshallese | 20.2 /100 | #199 | Fair 5.6% |
| Menominee | 18.6 /100 | #200 | Poor 5.6% |
| Immigrants | Morocco | 17.9 /100 | #201 | Poor 5.6% |
| Immigrants | Micronesia | 17.1 /100 | #202 | Poor 5.6% |
| Portuguese | 15.9 /100 | #203 | Poor 5.6% |
| Israelis | 15.6 /100 | #204 | Poor 5.6% |
| Tsimshian | 15.2 /100 | #205 | Poor 5.6% |
| Nicaraguans | 12.3 /100 | #206 | Poor 5.6% |
| Peruvians | 12.1 /100 | #207 | Poor 5.6% |
| Immigrants | Costa Rica | 11.6 /100 | #208 | Poor 5.6% |
| Immigrants | Western Asia | 11.3 /100 | #209 | Poor 5.6% |
| Immigrants | Nonimmigrants | 10.6 /100 | #210 | Poor 5.7% |
| Panamanians | 10.1 /100 | #211 | Poor 5.7% |
| South Americans | 10.0 /100 | #212 | Poor 5.7% |
| Americans | 8.9 /100 | #213 | Tragic 5.7% |
Demographics Similar to Immigrants from Central America by Unemployment Among Women with Children Under 18 years
In terms of unemployment among women with children under 18 years, the demographic groups most similar to Immigrants from Central America are Immigrants from Guyana (6.5%, a difference of 0.050%), Belizean (6.5%, a difference of 0.12%), African (6.5%, a difference of 0.34%), Ecuadorian (6.5%, a difference of 0.43%), and Guyanese (6.6%, a difference of 0.67%).
| Demographics | Rating | Rank | Unemployment Among Women with Children Under 18 years |
| Immigrants | Latin America | 0.0 /100 | #298 | Tragic 6.4% |
| Jamaicans | 0.0 /100 | #299 | Tragic 6.4% |
| Immigrants | Jamaica | 0.0 /100 | #300 | Tragic 6.4% |
| Immigrants | Haiti | 0.0 /100 | #301 | Tragic 6.4% |
| Immigrants | Armenia | 0.0 /100 | #302 | Tragic 6.5% |
| Immigrants | Honduras | 0.0 /100 | #303 | Tragic 6.5% |
| Vietnamese | 0.0 /100 | #304 | Tragic 6.5% |
| Immigrants | Central America | 0.0 /100 | #305 | Tragic 6.5% |
| Immigrants | Guyana | 0.0 /100 | #306 | Tragic 6.5% |
| Belizeans | 0.0 /100 | #307 | Tragic 6.5% |
| Africans | 0.0 /100 | #308 | Tragic 6.5% |
| Ecuadorians | 0.0 /100 | #309 | Tragic 6.5% |
| Guyanese | 0.0 /100 | #310 | Tragic 6.6% |
| Yaqui | 0.0 /100 | #311 | Tragic 6.6% |
| Immigrants | Mexico | 0.0 /100 | #312 | Tragic 6.6% |