Nicaraguan vs Immigrants from Central America Female Unemployment
COMPARE
Nicaraguan
Immigrants from Central America
Female Unemployment
Female Unemployment Comparison
Nicaraguans
Immigrants from Central America
5.5%
FEMALE UNEMPLOYMENT
7.2/ 100
METRIC RATING
222nd/ 347
METRIC RANK
6.2%
FEMALE UNEMPLOYMENT
0.0/ 100
METRIC RATING
306th/ 347
METRIC RANK
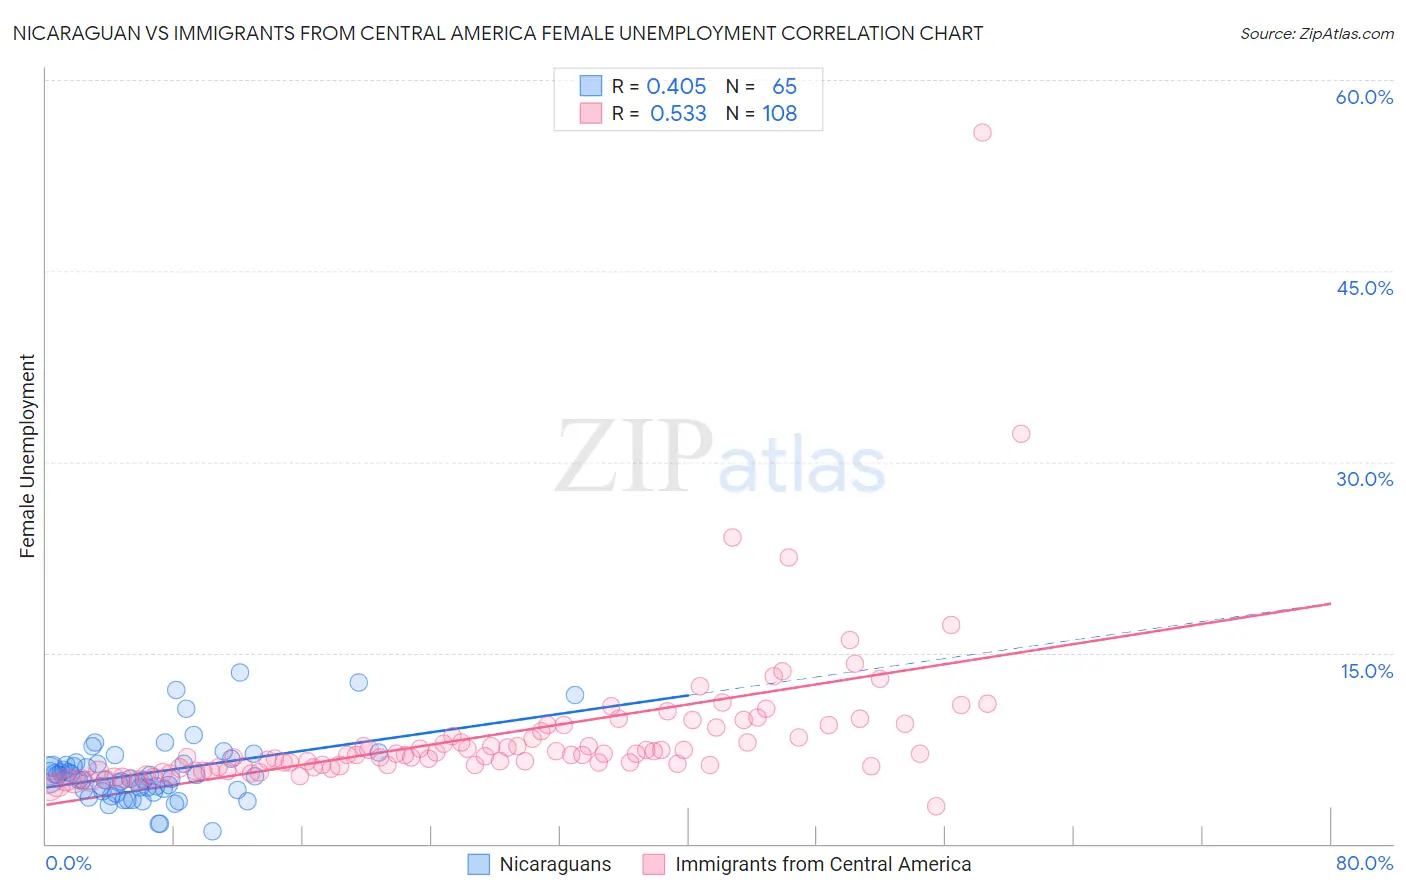
Nicaraguan vs Immigrants from Central America Female Unemployment Correlation Chart
The statistical analysis conducted on geographies consisting of 285,135,127 people shows a moderate positive correlation between the proportion of Nicaraguans and unemploymnet rate among females in the United States with a correlation coefficient (R) of 0.405 and weighted average of 5.5%. Similarly, the statistical analysis conducted on geographies consisting of 528,420,242 people shows a substantial positive correlation between the proportion of Immigrants from Central America and unemploymnet rate among females in the United States with a correlation coefficient (R) of 0.533 and weighted average of 6.2%, a difference of 14.1%.
Female Unemployment Correlation Summary
| Measurement | Nicaraguan | Immigrants from Central America |
| Minimum | 1.0% | 2.9% |
| Maximum | 13.5% | 55.9% |
| Range | 12.5% | 53.0% |
| Mean | 5.6% | 8.5% |
| Median | 5.1% | 7.0% |
| Interquartile 25% (IQ1) | 4.2% | 6.0% |
| Interquartile 75% (IQ3) | 6.3% | 9.0% |
| Interquartile Range (IQR) | 2.1% | 3.0% |
| Standard Deviation (Sample) | 2.4% | 6.1% |
| Standard Deviation (Population) | 2.4% | 6.1% |
Similar Demographics by Female Unemployment
Demographics Similar to Nicaraguans by Female Unemployment
In terms of female unemployment, the demographic groups most similar to Nicaraguans are Delaware (5.5%, a difference of 0.010%), Brazilian (5.5%, a difference of 0.020%), Iraqi (5.5%, a difference of 0.040%), Immigrants from Africa (5.4%, a difference of 0.26%), and South American (5.4%, a difference of 0.27%).
| Demographics | Rating | Rank | Female Unemployment |
| Immigrants | Nicaragua | 10.2 /100 | #215 | Poor 5.4% |
| Comanche | 10.0 /100 | #216 | Poor 5.4% |
| Peruvians | 9.6 /100 | #217 | Tragic 5.4% |
| Bermudans | 9.0 /100 | #218 | Tragic 5.4% |
| South Americans | 8.6 /100 | #219 | Tragic 5.4% |
| Immigrants | Africa | 8.5 /100 | #220 | Tragic 5.4% |
| Brazilians | 7.3 /100 | #221 | Tragic 5.5% |
| Nicaraguans | 7.2 /100 | #222 | Tragic 5.5% |
| Delaware | 7.2 /100 | #223 | Tragic 5.5% |
| Iraqis | 7.1 /100 | #224 | Tragic 5.5% |
| French American Indians | 6.1 /100 | #225 | Tragic 5.5% |
| Immigrants | Peru | 5.9 /100 | #226 | Tragic 5.5% |
| Immigrants | Philippines | 5.3 /100 | #227 | Tragic 5.5% |
| Israelis | 4.8 /100 | #228 | Tragic 5.5% |
| Panamanians | 4.7 /100 | #229 | Tragic 5.5% |
Demographics Similar to Immigrants from Central America by Female Unemployment
In terms of female unemployment, the demographic groups most similar to Immigrants from Central America are Shoshone (6.2%, a difference of 0.010%), Hispanic or Latino (6.2%, a difference of 0.070%), Spanish American Indian (6.2%, a difference of 0.16%), Immigrants from Jamaica (6.2%, a difference of 0.21%), and Barbadian (6.2%, a difference of 0.58%).
| Demographics | Rating | Rank | Female Unemployment |
| Ute | 0.0 /100 | #299 | Tragic 6.1% |
| Immigrants | Haiti | 0.0 /100 | #300 | Tragic 6.1% |
| Immigrants | Barbados | 0.0 /100 | #301 | Tragic 6.2% |
| U.S. Virgin Islanders | 0.0 /100 | #302 | Tragic 6.2% |
| Barbadians | 0.0 /100 | #303 | Tragic 6.2% |
| Immigrants | Jamaica | 0.0 /100 | #304 | Tragic 6.2% |
| Spanish American Indians | 0.0 /100 | #305 | Tragic 6.2% |
| Immigrants | Central America | 0.0 /100 | #306 | Tragic 6.2% |
| Shoshone | 0.0 /100 | #307 | Tragic 6.2% |
| Hispanics or Latinos | 0.0 /100 | #308 | Tragic 6.2% |
| Ecuadorians | 0.0 /100 | #309 | Tragic 6.3% |
| Central American Indians | 0.0 /100 | #310 | Tragic 6.3% |
| Immigrants | Mexico | 0.0 /100 | #311 | Tragic 6.3% |
| Immigrants | Grenada | 0.0 /100 | #312 | Tragic 6.3% |
| Belizeans | 0.0 /100 | #313 | Tragic 6.3% |