Nicaraguan vs Chickasaw Unemployment Among Ages 20 to 24 years

COMPARE

Nicaraguan
Race
Ancestry
AfghanAfricanAlaska NativeAlaskan AthabascanAlbanianAleutAlsatianAmericanApacheArabArapahoArgentineanArmenianAssyrian/Chaldean/SyriacAustralianAustrianBahamianBangladeshiBarbadianBasqueBelgianBelizeanBermudanBhutaneseBlackfeetBolivianBrazilianBritishBritish West IndianBulgarianBurmeseCajunCambodianCanadianCape VerdeanCarpatho RusynCelticCentral AmericanCentral American IndianCherokeeCheyenneChileanChineseChippewaChoctawColombianColvilleComancheCosta RicanCreeCreekCroatianCrowCubanCypriotCzechCzechoslovakianDanishDelawareDominicanDutchDutch West IndianEastern EuropeanEcuadorianEgyptianEnglishEstonianEthiopianEuropeanFijianFilipinoFinnishFrenchFrench American IndianFrench CanadianGermanGerman RussianGhanaianGreekGuamanian/ChamorroGuatemalanGuyaneseHaitianHmongHonduranHopiHoumaHungarianIcelanderIndian (Asian)IndonesianInupiatIranianIraqiIrishIroquoisIsraeliItalianJamaicanJapaneseJordanianKenyanKiowaKoreanLaotianLatvianLebaneseLiberianLithuanianLumbeeLuxembourgerMacedonianMalaysianMalteseMarshalleseMenomineeMexicanMexican American IndianMongolianMoroccanNative HawaiianNavajoNepaleseNew ZealanderNicaraguanNigerianNorthern EuropeanNorwegianOkinawanOsageOttawaPaiutePakistaniPalestinianPanamanianParaguayanPennsylvania GermanPeruvianPimaPolishPortuguesePotawatomiPuebloPuerto RicanPuget Sound SalishRomanianRussianSalvadoranSamoanScandinavianScotch-IrishScottishSeminoleSenegaleseSerbianShoshoneSierra LeoneanSiouxSlavicSlovakSloveneSomaliSouth AfricanSouth AmericanSouth American IndianSoviet UnionSpaniardSpanishSpanish AmericanSpanish American IndianSri LankanSubsaharan AfricanSudaneseSwedishSwissSyrianTaiwaneseThaiTlingit-HaidaTohono O'OdhamTonganTrinidadian and TobagonianTsimshianTurkishU.S. Virgin IslanderUgandanUkrainianUruguayanUteVenezuelanVietnameseWelshWest IndianYakamaYaquiYugoslavianYumanYup'ikZimbabwean
Immigration
NonimmigrantsImmigrantsAfghanistanAfricaAlbaniaArgentinaArmeniaAsiaAustraliaAustriaBahamasBangladeshBarbadosBelarusBelgiumBelizeBoliviaBosnia and HerzegovinaBrazilBulgariaBurma/MyanmarCabo VerdeCambodiaCameroonCanadaCaribbeanCentral AmericaChileChinaColombiaCongoCosta RicaCroatiaCubaCzechoslovakiaDenmarkDominicaDominican RepublicEastern AfricaEastern AsiaEastern EuropeEcuadorEgyptEl SalvadorEnglandEritreaEthiopiaEuropeFijiFranceGermanyGhanaGreeceGrenadaGuatemalaGuyanaHaitiHondurasHong KongHungaryIndiaIndonesiaIranIraqIrelandIsraelItalyJamaicaJapanJordanKazakhstanKenyaKoreaKuwaitLaosLatin AmericaLatviaLebanonLiberiaLithuaniaMalaysiaMexicoMicronesiaMiddle AfricaMoldovaMoroccoNepalNetherlandsNicaraguaNigeriaNorth AmericaNorth MacedoniaNorthern AfricaNorthern EuropeNorwayOceaniaPakistanPanamaPeruPhilippinesPolandPortugalRomaniaRussiaSaudi ArabiaScotlandSenegalSerbiaSierra LeoneSingaporeSomaliaSouth AfricaSouth AmericaSouth Central AsiaSouth Eastern AsiaSouthern EuropeSpainSri LankaSt. Vincent and the GrenadinesSudanSwedenSwitzerlandSyriaTaiwanThailandTrinidad and TobagoTurkeyUgandaUkraineUruguayUzbekistanVenezuelaVietnamWest IndiesWestern AfricaWestern AsiaWestern EuropeYemenZaireZimbabweAzores
Chickasaw
Race
Ancestry
AfghanAfricanAlaska NativeAlaskan AthabascanAlbanianAleutAlsatianAmericanApacheArabArapahoArgentineanArmenianAssyrian/Chaldean/SyriacAustralianAustrianBahamianBangladeshiBarbadianBasqueBelgianBelizeanBermudanBhutaneseBlackfeetBolivianBrazilianBritishBritish West IndianBulgarianBurmeseCajunCambodianCanadianCape VerdeanCarpatho RusynCelticCentral AmericanCentral American IndianCherokeeCheyenneChickasawChileanChineseChippewaChoctawColombianColvilleComancheCosta RicanCreeCreekCroatianCrowCubanCypriotCzechCzechoslovakianDanishDelawareDominicanDutchDutch West IndianEastern EuropeanEcuadorianEgyptianEnglishEstonianEthiopianEuropeanFijianFilipinoFinnishFrenchFrench American IndianFrench CanadianGermanGerman RussianGhanaianGreekGuamanian/ChamorroGuatemalanGuyaneseHaitianHmongHonduranHopiHoumaHungarianIcelanderIndian (Asian)IndonesianInupiatIranianIraqiIrishIroquoisIsraeliItalianJamaicanJapaneseJordanianKenyanKiowaKoreanLaotianLatvianLebaneseLiberianLithuanianLumbeeLuxembourgerMacedonianMalaysianMalteseMarshalleseMenomineeMexicanMexican American IndianMongolianMoroccanNative HawaiianNavajoNepaleseNew ZealanderNigerianNorthern EuropeanNorwegianOkinawanOsageOttawaPaiutePakistaniPalestinianPanamanianParaguayanPennsylvania GermanPeruvianPimaPolishPortuguesePotawatomiPuebloPuerto RicanPuget Sound SalishRomanianRussianSalvadoranSamoanScandinavianScotch-IrishScottishSeminoleSenegaleseSerbianShoshoneSierra LeoneanSiouxSlavicSlovakSloveneSomaliSouth AfricanSouth AmericanSouth American IndianSoviet UnionSpaniardSpanishSpanish AmericanSpanish American IndianSri LankanSubsaharan AfricanSudaneseSwedishSwissSyrianTaiwaneseThaiTlingit-HaidaTohono O'OdhamTonganTrinidadian and TobagonianTsimshianTurkishU.S. Virgin IslanderUgandanUkrainianUruguayanUteVenezuelanVietnameseWelshWest IndianYakamaYaquiYugoslavianYumanYup'ikZimbabwean
Immigration
NonimmigrantsImmigrantsAfghanistanAfricaAlbaniaArgentinaArmeniaAsiaAustraliaAustriaBahamasBangladeshBarbadosBelarusBelgiumBelizeBoliviaBosnia and HerzegovinaBrazilBulgariaBurma/MyanmarCabo VerdeCambodiaCameroonCanadaCaribbeanCentral AmericaChileChinaColombiaCongoCosta RicaCroatiaCubaCzechoslovakiaDenmarkDominicaDominican RepublicEastern AfricaEastern AsiaEastern EuropeEcuadorEgyptEl SalvadorEnglandEritreaEthiopiaEuropeFijiFranceGermanyGhanaGreeceGrenadaGuatemalaGuyanaHaitiHondurasHong KongHungaryIndiaIndonesiaIranIraqIrelandIsraelItalyJamaicaJapanJordanKazakhstanKenyaKoreaKuwaitLaosLatin AmericaLatviaLebanonLiberiaLithuaniaMalaysiaMexicoMicronesiaMiddle AfricaMoldovaMoroccoNepalNetherlandsNicaraguaNigeriaNorth AmericaNorth MacedoniaNorthern AfricaNorthern EuropeNorwayOceaniaPakistanPanamaPeruPhilippinesPolandPortugalRomaniaRussiaSaudi ArabiaScotlandSenegalSerbiaSierra LeoneSingaporeSomaliaSouth AfricaSouth AmericaSouth Central AsiaSouth Eastern AsiaSouthern EuropeSpainSri LankaSt. Vincent and the GrenadinesSudanSwedenSwitzerlandSyriaTaiwanThailandTrinidad and TobagoTurkeyUgandaUkraineUruguayUzbekistanVenezuelaVietnamWest IndiesWestern AfricaWestern AsiaWestern EuropeYemenZaireZimbabweAzores
Unemployment Among Ages 20 to 24 years
Income
Poverty
Unemployment
Labor Participation
Family Structure
Vehicle Availability
Education Level
Disability

Unemployment Among Ages 20 to 24 years Comparison

Nicaraguans

Chickasaw

Exceptional
Exceptional
9.8%
UNEMPLOYMENT AMONG AGES 20 TO 24 YEARS
99.6/ 100
METRIC RATING
56th/ 347
METRIC RANK
9.9%
UNEMPLOYMENT AMONG AGES 20 TO 24 YEARS
98.4/ 100
METRIC RATING
77th/ 347
METRIC RANK

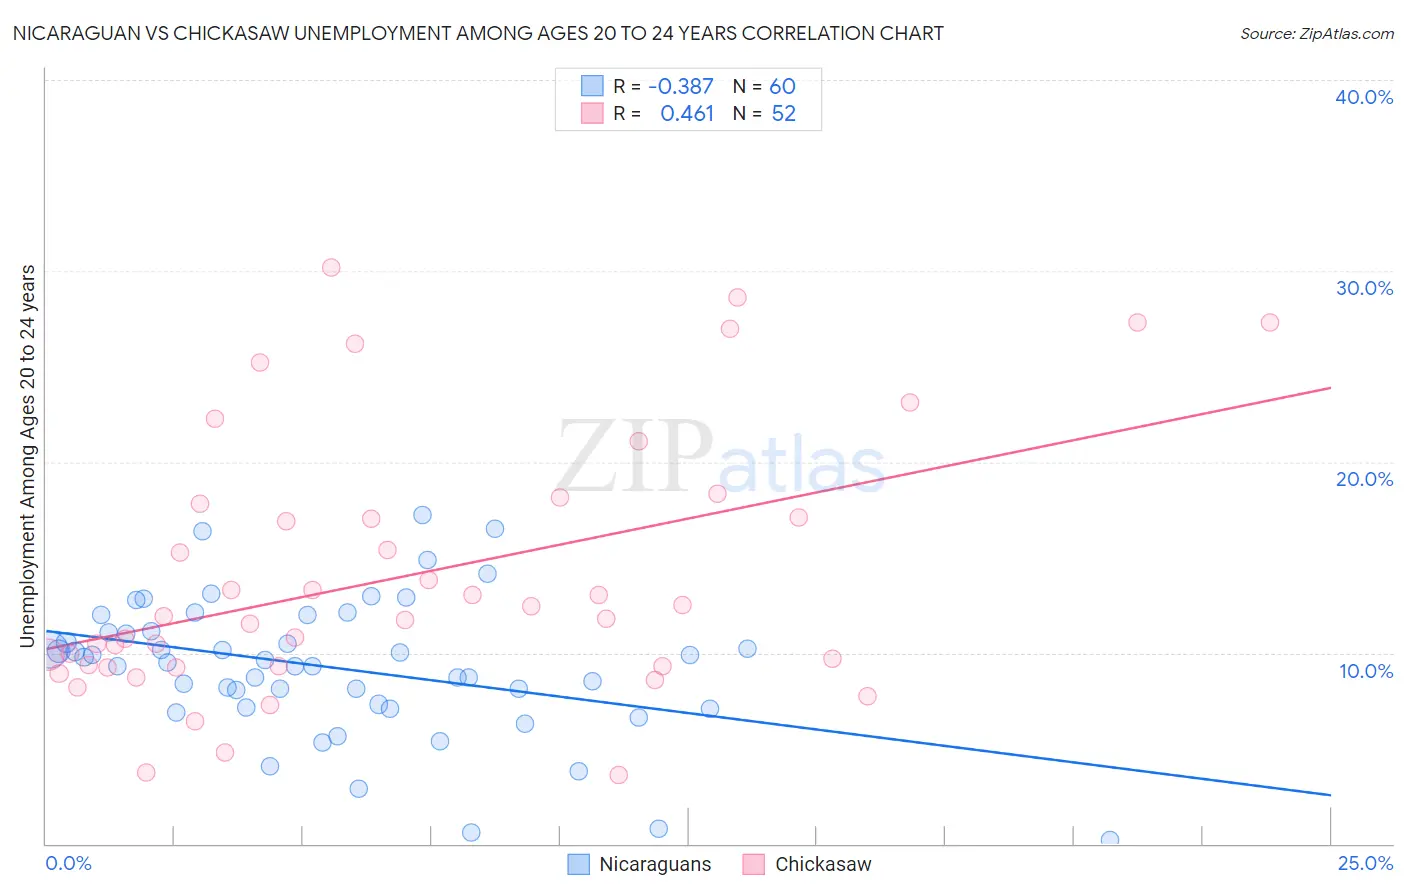
Nicaraguan vs Chickasaw Unemployment Among Ages 20 to 24 years Correlation Chart

The statistical analysis conducted on geographies consisting of 280,758,738 people shows a mild negative correlation between the proportion of Nicaraguans and unemployment rate among population between the ages 20 and 24 in the United States with a correlation coefficient (R) of -0.387 and weighted average of 9.8%. Similarly, the statistical analysis conducted on geographies consisting of 145,013,738 people shows a moderate positive correlation between the proportion of Chickasaw and unemployment rate among population between the ages 20 and 24 in the United States with a correlation coefficient (R) of 0.461 and weighted average of 9.9%, a difference of 1.3%.
Nicaraguan vs Chickasaw Unemployment Among Ages 20 to 24 years

Unemployment Among Ages 20 to 24 years Correlation Summary

MeasurementNicaraguanChickasaw
Minimum0.20%3.6%
Maximum17.2%30.2%
Range17.0%26.6%
Mean9.2%14.0%
Median9.6%11.9%
Interquartile 25% (IQ1)7.2%9.3%
Interquartile 75% (IQ3)11.1%17.5%
Interquartile Range (IQR)3.9%8.2%
Standard Deviation (Sample)3.6%6.8%
Standard Deviation (Population)3.6%6.7%

Similar Demographics by Unemployment Among Ages 20 to 24 years

Demographics Similar to Nicaraguans by Unemployment Among Ages 20 to 24 years

In terms of unemployment among ages 20 to 24 years, the demographic groups most similar to Nicaraguans are Carpatho Rusyn (9.8%, a difference of 0.010%), Immigrants from Cambodia (9.8%, a difference of 0.14%), Immigrants from Moldova (9.8%, a difference of 0.14%), Immigrants from Serbia (9.8%, a difference of 0.17%), and Pakistani (9.8%, a difference of 0.19%).
DemographicsRating | RankUnemployment Among Ages 20 to 24 years
Creek
99.8
/100
|
#49
Exceptional
9.7%
Immigrants | Kenya
99.7
/100
|
#50
Exceptional
9.7%
Ethiopians
99.7
/100
|
#51
Exceptional
9.8%
Immigrants | Thailand
99.7
/100
|
#52
Exceptional
9.8%
Immigrants | Serbia
99.6
/100
|
#53
Exceptional
9.8%
Immigrants | Cambodia
99.6
/100
|
#54
Exceptional
9.8%
Carpatho Rusyns
99.6
/100
|
#55
Exceptional
9.8%
Nicaraguans
99.6
/100
|
#56
Exceptional
9.8%
Immigrants | Moldova
99.5
/100
|
#57
Exceptional
9.8%
Pakistanis
99.5
/100
|
#58
Exceptional
9.8%
English
99.5
/100
|
#59
Exceptional
9.8%
Immigrants | Kuwait
99.5
/100
|
#60
Exceptional
9.8%
Malaysians
99.5
/100
|
#61
Exceptional
9.8%
Immigrants | Singapore
99.4
/100
|
#62
Exceptional
9.8%
British
99.4
/100
|
#63
Exceptional
9.8%

Demographics Similar to Chickasaw by Unemployment Among Ages 20 to 24 years

In terms of unemployment among ages 20 to 24 years, the demographic groups most similar to Chickasaw are Czechoslovakian (9.9%, a difference of 0.020%), Assyrian/Chaldean/Syriac (9.9%, a difference of 0.030%), Icelander (9.9%, a difference of 0.050%), Immigrants from Netherlands (9.9%, a difference of 0.10%), and Immigrants from Australia (9.9%, a difference of 0.11%).
DemographicsRating | RankUnemployment Among Ages 20 to 24 years
Immigrants | Croatia
99.0
/100
|
#70
Exceptional
9.9%
Celtics
98.9
/100
|
#71
Exceptional
9.9%
Bolivians
98.9
/100
|
#72
Exceptional
9.9%
Kenyans
98.7
/100
|
#73
Exceptional
9.9%
Immigrants | Laos
98.7
/100
|
#74
Exceptional
9.9%
Immigrants | Australia
98.6
/100
|
#75
Exceptional
9.9%
Czechoslovakians
98.4
/100
|
#76
Exceptional
9.9%
Chickasaw
98.4
/100
|
#77
Exceptional
9.9%
Assyrians/Chaldeans/Syriacs
98.3
/100
|
#78
Exceptional
9.9%
Icelanders
98.3
/100
|
#79
Exceptional
9.9%
Immigrants | Netherlands
98.2
/100
|
#80
Exceptional
9.9%
Yaqui
98.0
/100
|
#81
Exceptional
9.9%
Sri Lankans
98.0
/100
|
#82
Exceptional
9.9%
Immigrants | Bulgaria
98.0
/100
|
#83
Exceptional
9.9%
Latvians
97.9
/100
|
#84
Exceptional
9.9%