Native/Alaskan vs Nicaraguan Unemployment Among Youth under 25 years
COMPARE
Native/Alaskan
Nicaraguan
Unemployment Among Youth under 25 years
Unemployment Among Youth under 25 years Comparison
Natives/Alaskans
Nicaraguans
14.5%
UNEMPLOYMENT AMONG YOUTH UNDER 25 YEARS
0.0/ 100
METRIC RATING
316th/ 347
METRIC RANK
11.3%
UNEMPLOYMENT AMONG YOUTH UNDER 25 YEARS
94.3/ 100
METRIC RATING
97th/ 347
METRIC RANK
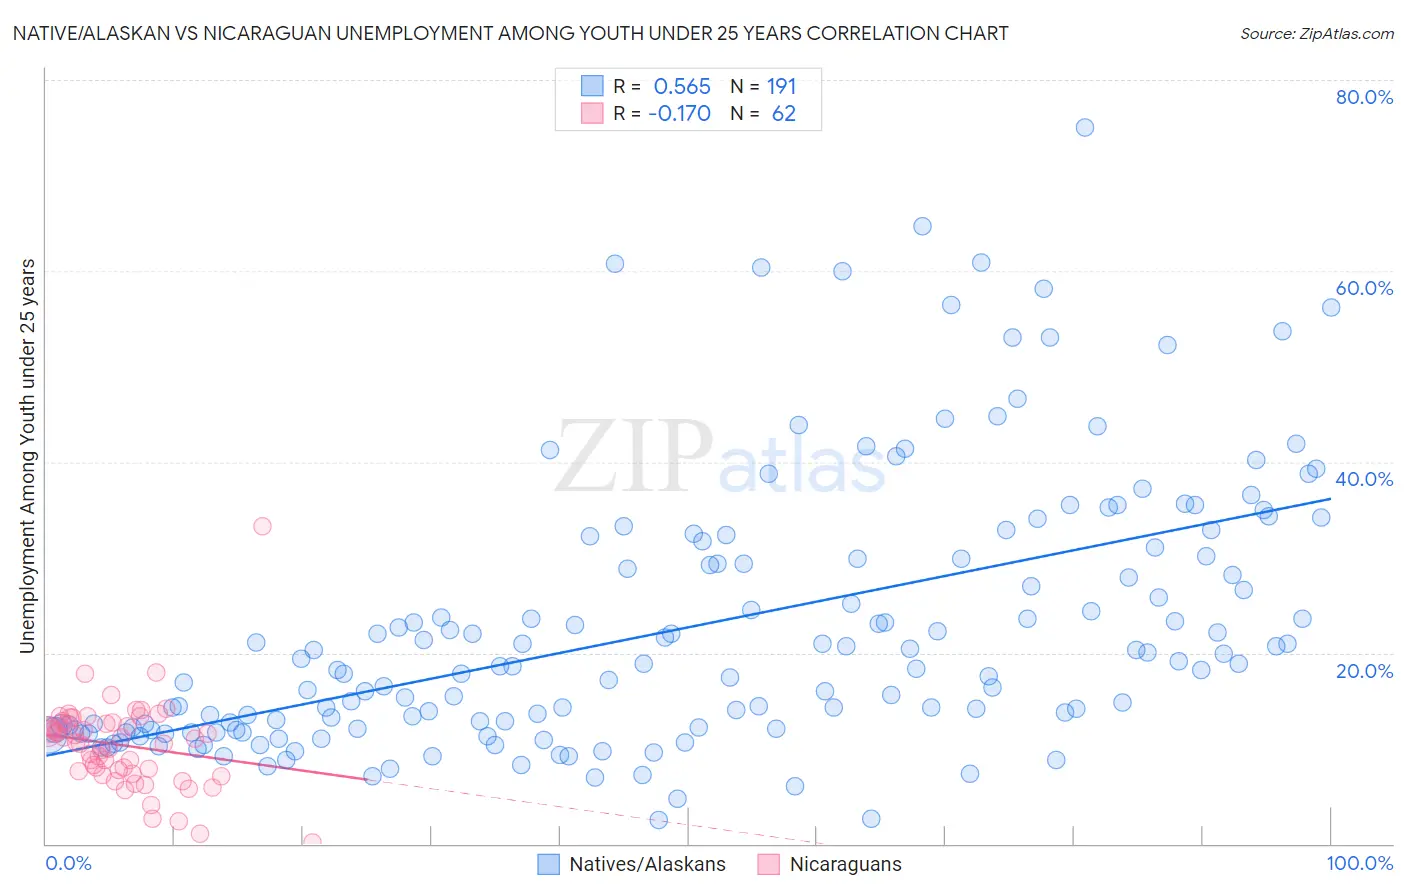
Native/Alaskan vs Nicaraguan Unemployment Among Youth under 25 years Correlation Chart
The statistical analysis conducted on geographies consisting of 499,955,356 people shows a substantial positive correlation between the proportion of Natives/Alaskans and unemployment rate among youth under the age of 25 in the United States with a correlation coefficient (R) of 0.565 and weighted average of 14.5%. Similarly, the statistical analysis conducted on geographies consisting of 284,206,393 people shows a poor negative correlation between the proportion of Nicaraguans and unemployment rate among youth under the age of 25 in the United States with a correlation coefficient (R) of -0.170 and weighted average of 11.3%, a difference of 28.3%.
Unemployment Among Youth under 25 years Correlation Summary
| Measurement | Native/Alaskan | Nicaraguan |
| Minimum | 2.4% | 0.10% |
| Maximum | 75.0% | 33.3% |
| Range | 72.6% | 33.2% |
| Mean | 22.6% | 10.3% |
| Median | 18.5% | 10.8% |
| Interquartile 25% (IQ1) | 12.0% | 7.6% |
| Interquartile 75% (IQ3) | 29.9% | 12.7% |
| Interquartile Range (IQR) | 17.9% | 5.1% |
| Standard Deviation (Sample) | 14.0% | 4.8% |
| Standard Deviation (Population) | 14.0% | 4.7% |
Similar Demographics by Unemployment Among Youth under 25 years
Demographics Similar to Natives/Alaskans by Unemployment Among Youth under 25 years
In terms of unemployment among youth under 25 years, the demographic groups most similar to Natives/Alaskans are Black/African American (14.5%, a difference of 0.090%), Sioux (14.4%, a difference of 0.42%), Jamaican (14.4%, a difference of 0.54%), Immigrants from Armenia (14.4%, a difference of 0.63%), and Immigrants from Dominica (14.6%, a difference of 0.80%).
| Demographics | Rating | Rank | Unemployment Among Youth under 25 years |
| Aleuts | 0.0 /100 | #309 | Tragic 14.1% |
| Immigrants | West Indies | 0.0 /100 | #310 | Tragic 14.2% |
| Immigrants | Bangladesh | 0.0 /100 | #311 | Tragic 14.2% |
| Vietnamese | 0.0 /100 | #312 | Tragic 14.3% |
| Immigrants | Armenia | 0.0 /100 | #313 | Tragic 14.4% |
| Jamaicans | 0.0 /100 | #314 | Tragic 14.4% |
| Sioux | 0.0 /100 | #315 | Tragic 14.4% |
| Natives/Alaskans | 0.0 /100 | #316 | Tragic 14.5% |
| Blacks/African Americans | 0.0 /100 | #317 | Tragic 14.5% |
| Immigrants | Dominica | 0.0 /100 | #318 | Tragic 14.6% |
| West Indians | 0.0 /100 | #319 | Tragic 14.6% |
| Barbadians | 0.0 /100 | #320 | Tragic 14.6% |
| Cheyenne | 0.0 /100 | #321 | Tragic 14.6% |
| Trinidadians and Tobagonians | 0.0 /100 | #322 | Tragic 14.6% |
| Immigrants | Trinidad and Tobago | 0.0 /100 | #323 | Tragic 14.6% |
Demographics Similar to Nicaraguans by Unemployment Among Youth under 25 years
In terms of unemployment among youth under 25 years, the demographic groups most similar to Nicaraguans are Estonian (11.3%, a difference of 0.0%), Immigrants from Serbia (11.3%, a difference of 0.020%), Carpatho Rusyn (11.3%, a difference of 0.030%), Celtic (11.3%, a difference of 0.050%), and Pakistani (11.3%, a difference of 0.060%).
| Demographics | Rating | Rank | Unemployment Among Youth under 25 years |
| Immigrants | Bolivia | 95.5 /100 | #90 | Exceptional 11.2% |
| Immigrants | Taiwan | 95.1 /100 | #91 | Exceptional 11.2% |
| Immigrants | Latvia | 95.1 /100 | #92 | Exceptional 11.2% |
| Immigrants | North America | 95.1 /100 | #93 | Exceptional 11.2% |
| Lithuanians | 94.8 /100 | #94 | Exceptional 11.3% |
| Carpatho Rusyns | 94.4 /100 | #95 | Exceptional 11.3% |
| Immigrants | Serbia | 94.4 /100 | #96 | Exceptional 11.3% |
| Nicaraguans | 94.3 /100 | #97 | Exceptional 11.3% |
| Estonians | 94.2 /100 | #98 | Exceptional 11.3% |
| Celtics | 94.0 /100 | #99 | Exceptional 11.3% |
| Pakistanis | 94.0 /100 | #100 | Exceptional 11.3% |
| Iroquois | 93.8 /100 | #101 | Exceptional 11.3% |
| Immigrants | Thailand | 93.6 /100 | #102 | Exceptional 11.3% |
| Immigrants | Malaysia | 93.6 /100 | #103 | Exceptional 11.3% |
| Immigrants | Afghanistan | 93.4 /100 | #104 | Exceptional 11.3% |