Native/Alaskan vs Bermudan Unemployment Among Ages 25 to 29 years

COMPARE

Native/Alaskan
Race
Ancestry
AfghanAfricanAlaska NativeAlaskan AthabascanAlbanianAleutAlsatianAmericanApacheArabArapahoArgentineanArmenianAssyrian/Chaldean/SyriacAustralianAustrianBahamianBangladeshiBarbadianBasqueBelgianBelizeanBhutaneseBlackfeetBolivianBrazilianBritishBritish West IndianBulgarianBurmeseCajunCambodianCanadianCape VerdeanCarpatho RusynCelticCentral AmericanCentral American IndianCherokeeCheyenneChickasawChileanChineseChippewaChoctawColombianColvilleComancheCosta RicanCreeCreekCroatianCrowCubanCypriotCzechCzechoslovakianDanishDelawareDominicanDutchDutch West IndianEastern EuropeanEcuadorianEgyptianEnglishEstonianEthiopianEuropeanFijianFilipinoFinnishFrenchFrench American IndianFrench CanadianGermanGerman RussianGhanaianGreekGuamanian/ChamorroGuatemalanGuyaneseHaitianHmongHonduranHopiHoumaHungarianIcelanderIndian (Asian)IndonesianInupiatIranianIraqiIrishIroquoisIsraeliItalianJamaicanJapaneseJordanianKenyanKiowaKoreanLaotianLatvianLebaneseLiberianLithuanianLumbeeLuxembourgerMacedonianMalaysianMalteseMarshalleseMenomineeMexicanMexican American IndianMongolianMoroccanNative HawaiianNavajoNepaleseNew ZealanderNicaraguanNigerianNorthern EuropeanNorwegianOkinawanOsageOttawaPaiutePakistaniPalestinianPanamanianParaguayanPennsylvania GermanPeruvianPimaPolishPortuguesePotawatomiPuebloPuerto RicanPuget Sound SalishRomanianRussianSalvadoranSamoanScandinavianScotch-IrishScottishSeminoleSenegaleseSerbianShoshoneSierra LeoneanSiouxSlavicSlovakSloveneSomaliSouth AfricanSouth AmericanSouth American IndianSoviet UnionSpaniardSpanishSpanish AmericanSpanish American IndianSri LankanSubsaharan AfricanSudaneseSwedishSwissSyrianTaiwaneseThaiTlingit-HaidaTohono O'OdhamTonganTrinidadian and TobagonianTsimshianTurkishU.S. Virgin IslanderUgandanUkrainianUruguayanUteVenezuelanVietnameseWelshWest IndianYakamaYaquiYugoslavianYumanYup'ikZimbabwean
Immigration
NonimmigrantsImmigrantsAfghanistanAfricaAlbaniaArgentinaArmeniaAsiaAustraliaAustriaBahamasBangladeshBarbadosBelarusBelgiumBelizeBoliviaBosnia and HerzegovinaBrazilBulgariaBurma/MyanmarCabo VerdeCambodiaCameroonCanadaCaribbeanCentral AmericaChileChinaColombiaCongoCosta RicaCroatiaCubaCzechoslovakiaDenmarkDominicaDominican RepublicEastern AfricaEastern AsiaEastern EuropeEcuadorEgyptEl SalvadorEnglandEritreaEthiopiaEuropeFijiFranceGermanyGhanaGreeceGrenadaGuatemalaGuyanaHaitiHondurasHong KongHungaryIndiaIndonesiaIranIraqIrelandIsraelItalyJamaicaJapanJordanKazakhstanKenyaKoreaKuwaitLaosLatin AmericaLatviaLebanonLiberiaLithuaniaMalaysiaMexicoMicronesiaMiddle AfricaMoldovaMoroccoNepalNetherlandsNicaraguaNigeriaNorth AmericaNorth MacedoniaNorthern AfricaNorthern EuropeNorwayOceaniaPakistanPanamaPeruPhilippinesPolandPortugalRomaniaRussiaSaudi ArabiaScotlandSenegalSerbiaSierra LeoneSingaporeSomaliaSouth AfricaSouth AmericaSouth Central AsiaSouth Eastern AsiaSouthern EuropeSpainSri LankaSt. Vincent and the GrenadinesSudanSwedenSwitzerlandSyriaTaiwanThailandTrinidad and TobagoTurkeyUgandaUkraineUruguayUzbekistanVenezuelaVietnamWest IndiesWestern AfricaWestern AsiaWestern EuropeYemenZaireZimbabweAzores
Bermudan
Race
Ancestry
AfghanAfricanAlaska NativeAlaskan AthabascanAlbanianAleutAlsatianAmericanApacheArabArapahoArgentineanArmenianAssyrian/Chaldean/SyriacAustralianAustrianBahamianBangladeshiBarbadianBasqueBelgianBelizeanBermudanBhutaneseBlackfeetBolivianBrazilianBritishBritish West IndianBulgarianBurmeseCajunCambodianCanadianCape VerdeanCarpatho RusynCelticCentral AmericanCentral American IndianCherokeeCheyenneChickasawChileanChineseChippewaChoctawColombianColvilleComancheCosta RicanCreeCreekCroatianCrowCubanCypriotCzechCzechoslovakianDanishDelawareDominicanDutchDutch West IndianEastern EuropeanEcuadorianEgyptianEnglishEstonianEthiopianEuropeanFijianFilipinoFinnishFrenchFrench American IndianFrench CanadianGermanGerman RussianGhanaianGreekGuamanian/ChamorroGuatemalanGuyaneseHaitianHmongHonduranHopiHoumaHungarianIcelanderIndian (Asian)IndonesianInupiatIranianIraqiIrishIroquoisIsraeliItalianJamaicanJapaneseJordanianKenyanKiowaKoreanLaotianLatvianLebaneseLiberianLithuanianLumbeeLuxembourgerMacedonianMalaysianMalteseMarshalleseMenomineeMexicanMexican American IndianMongolianMoroccanNative HawaiianNavajoNepaleseNew ZealanderNicaraguanNigerianNorthern EuropeanNorwegianOkinawanOsageOttawaPaiutePakistaniPalestinianPanamanianParaguayanPennsylvania GermanPeruvianPimaPolishPortuguesePotawatomiPuebloPuerto RicanPuget Sound SalishRomanianRussianSalvadoranSamoanScandinavianScotch-IrishScottishSeminoleSenegaleseSerbianShoshoneSierra LeoneanSiouxSlavicSlovakSloveneSomaliSouth AfricanSouth AmericanSouth American IndianSoviet UnionSpaniardSpanishSpanish AmericanSpanish American IndianSri LankanSubsaharan AfricanSudaneseSwedishSwissSyrianTaiwaneseThaiTlingit-HaidaTohono O'OdhamTonganTrinidadian and TobagonianTsimshianTurkishU.S. Virgin IslanderUgandanUkrainianUruguayanUteVenezuelanVietnameseWelshWest IndianYakamaYaquiYugoslavianYumanYup'ikZimbabwean
Immigration
NonimmigrantsImmigrantsAfghanistanAfricaAlbaniaArgentinaArmeniaAsiaAustraliaAustriaBahamasBangladeshBarbadosBelarusBelgiumBelizeBoliviaBosnia and HerzegovinaBrazilBulgariaBurma/MyanmarCabo VerdeCambodiaCameroonCanadaCaribbeanCentral AmericaChileChinaColombiaCongoCosta RicaCroatiaCubaCzechoslovakiaDenmarkDominicaDominican RepublicEastern AfricaEastern AsiaEastern EuropeEcuadorEgyptEl SalvadorEnglandEritreaEthiopiaEuropeFijiFranceGermanyGhanaGreeceGrenadaGuatemalaGuyanaHaitiHondurasHong KongHungaryIndiaIndonesiaIranIraqIrelandIsraelItalyJamaicaJapanJordanKazakhstanKenyaKoreaKuwaitLaosLatin AmericaLatviaLebanonLiberiaLithuaniaMalaysiaMexicoMicronesiaMiddle AfricaMoldovaMoroccoNepalNetherlandsNicaraguaNigeriaNorth AmericaNorth MacedoniaNorthern AfricaNorthern EuropeNorwayOceaniaPakistanPanamaPeruPhilippinesPolandPortugalRomaniaRussiaSaudi ArabiaScotlandSenegalSerbiaSierra LeoneSingaporeSomaliaSouth AfricaSouth AmericaSouth Central AsiaSouth Eastern AsiaSouthern EuropeSpainSri LankaSt. Vincent and the GrenadinesSudanSwedenSwitzerlandSyriaTaiwanThailandTrinidad and TobagoTurkeyUgandaUkraineUruguayUzbekistanVenezuelaVietnamWest IndiesWestern AfricaWestern AsiaWestern EuropeYemenZaireZimbabweAzores
Unemployment Among Ages 25 to 29 years
Income
Poverty
Unemployment
Labor Participation
Family Structure
Vehicle Availability
Education Level
Disability

Unemployment Among Ages 25 to 29 years Comparison

Natives/Alaskans

Bermudans

Tragic
Tragic
9.8%
UNEMPLOYMENT AMONG AGES 25 TO 29 YEARS
0.0/ 100
METRIC RATING
330th/ 347
METRIC RANK
7.0%
UNEMPLOYMENT AMONG AGES 25 TO 29 YEARS
3.8/ 100
METRIC RATING
229th/ 347
METRIC RANK

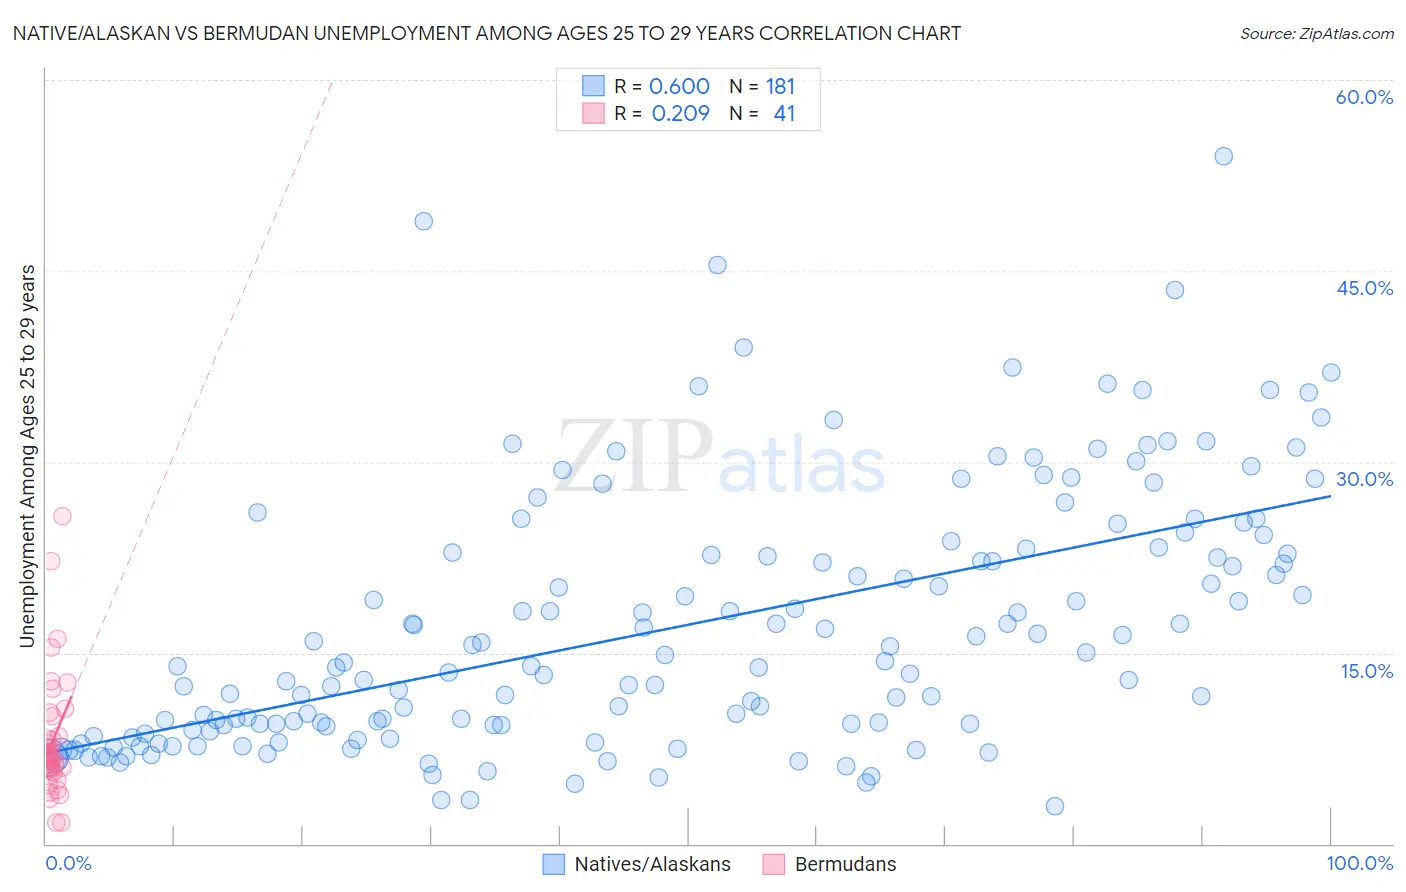
Native/Alaskan vs Bermudan Unemployment Among Ages 25 to 29 years Correlation Chart

The statistical analysis conducted on geographies consisting of 472,592,888 people shows a significant positive correlation between the proportion of Natives/Alaskans and unemployment rate among population between the ages 25 and 29 in the United States with a correlation coefficient (R) of 0.600 and weighted average of 9.8%. Similarly, the statistical analysis conducted on geographies consisting of 55,384,018 people shows a weak positive correlation between the proportion of Bermudans and unemployment rate among population between the ages 25 and 29 in the United States with a correlation coefficient (R) of 0.209 and weighted average of 7.0%, a difference of 40.8%.
Native/Alaskan vs Bermudan Unemployment Among Ages 25 to 29 years

Unemployment Among Ages 25 to 29 years Correlation Summary

MeasurementNative/AlaskanBermudan
Minimum2.9%1.7%
Maximum54.0%25.7%
Range51.1%24.0%
Mean17.0%8.1%
Median14.0%6.9%
Interquartile 25% (IQ1)9.1%5.8%
Interquartile 75% (IQ3)23.0%9.2%
Interquartile Range (IQR)13.9%3.4%
Standard Deviation (Sample)10.1%4.8%
Standard Deviation (Population)10.1%4.8%

Similar Demographics by Unemployment Among Ages 25 to 29 years

Demographics Similar to Natives/Alaskans by Unemployment Among Ages 25 to 29 years

In terms of unemployment among ages 25 to 29 years, the demographic groups most similar to Natives/Alaskans are Aleut (9.7%, a difference of 1.4%), Apache (9.5%, a difference of 3.6%), Alaska Native (10.2%, a difference of 3.7%), Pueblo (10.4%, a difference of 6.1%), and Colville (9.2%, a difference of 6.3%).
DemographicsRating | RankUnemployment Among Ages 25 to 29 years
Dominicans
0.0
/100
|
#323
Tragic
8.7%
Houma
0.0
/100
|
#324
Tragic
8.7%
Yakama
0.0
/100
|
#325
Tragic
8.8%
Shoshone
0.0
/100
|
#326
Tragic
9.2%
Colville
0.0
/100
|
#327
Tragic
9.2%
Apache
0.0
/100
|
#328
Tragic
9.5%
Aleuts
0.0
/100
|
#329
Tragic
9.7%
Natives/Alaskans
0.0
/100
|
#330
Tragic
9.8%
Alaska Natives
0.0
/100
|
#331
Tragic
10.2%
Pueblo
0.0
/100
|
#332
Tragic
10.4%
Alaskan Athabascans
0.0
/100
|
#333
Tragic
10.8%
Yuman
0.0
/100
|
#334
Tragic
11.0%
Puerto Ricans
0.0
/100
|
#335
Tragic
11.1%
Lumbee
0.0
/100
|
#336
Tragic
11.2%
Menominee
0.0
/100
|
#337
Tragic
11.3%

Demographics Similar to Bermudans by Unemployment Among Ages 25 to 29 years

In terms of unemployment among ages 25 to 29 years, the demographic groups most similar to Bermudans are Immigrants from El Salvador (7.0%, a difference of 0.080%), Immigrants from Panama (7.0%, a difference of 0.15%), Salvadoran (7.0%, a difference of 0.21%), Immigrants from Liberia (7.0%, a difference of 0.34%), and Central American (7.0%, a difference of 0.37%).
DemographicsRating | RankUnemployment Among Ages 25 to 29 years
Spaniards
7.7
/100
|
#222
Tragic
6.9%
Celtics
7.6
/100
|
#223
Tragic
6.9%
Immigrants | Immigrants
6.2
/100
|
#224
Tragic
6.9%
Japanese
5.4
/100
|
#225
Tragic
6.9%
Immigrants | Liberia
4.8
/100
|
#226
Tragic
7.0%
Salvadorans
4.4
/100
|
#227
Tragic
7.0%
Immigrants | Panama
4.2
/100
|
#228
Tragic
7.0%
Bermudans
3.8
/100
|
#229
Tragic
7.0%
Immigrants | El Salvador
3.6
/100
|
#230
Tragic
7.0%
Central Americans
3.0
/100
|
#231
Tragic
7.0%
Spanish Americans
2.7
/100
|
#232
Tragic
7.0%
Immigrants | Honduras
2.4
/100
|
#233
Tragic
7.0%
French Canadians
2.4
/100
|
#234
Tragic
7.0%
Panamanians
2.1
/100
|
#235
Tragic
7.0%
Cape Verdeans
1.9
/100
|
#236
Tragic
7.0%