Mexican American Indian vs Immigrants from Japan Male Unemployment
COMPARE
Mexican American Indian
Immigrants from Japan
Male Unemployment
Male Unemployment Comparison
Mexican American Indians
Immigrants from Japan
5.8%
MALE UNEMPLOYMENT
0.2/ 100
METRIC RATING
253rd/ 347
METRIC RANK
4.9%
MALE UNEMPLOYMENT
99.2/ 100
METRIC RATING
43rd/ 347
METRIC RANK
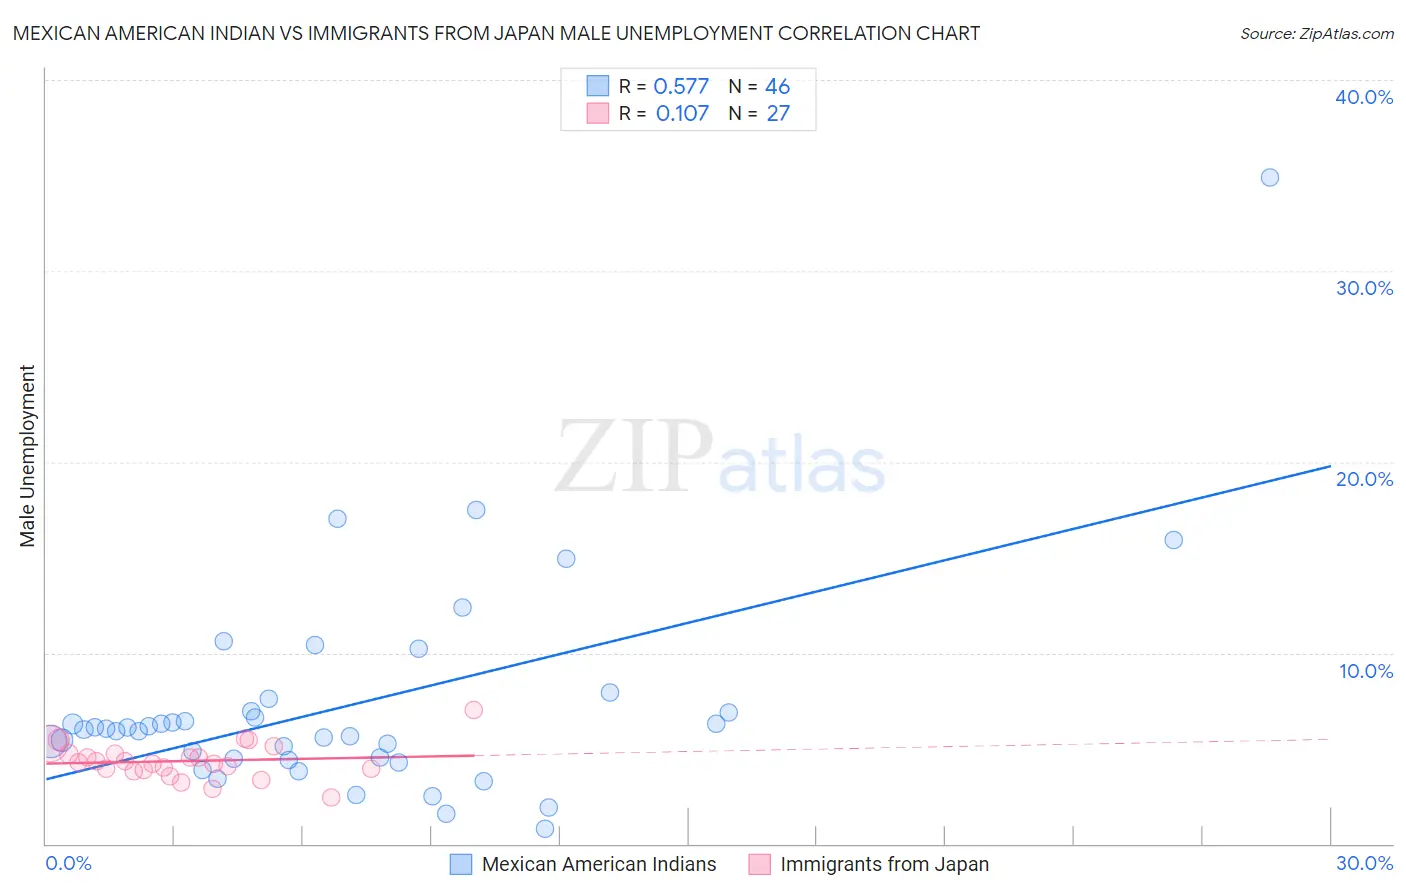
Mexican American Indian vs Immigrants from Japan Male Unemployment Correlation Chart
The statistical analysis conducted on geographies consisting of 316,861,577 people shows a substantial positive correlation between the proportion of Mexican American Indians and unemployment rate among males in the United States with a correlation coefficient (R) of 0.577 and weighted average of 5.8%. Similarly, the statistical analysis conducted on geographies consisting of 339,113,647 people shows a poor positive correlation between the proportion of Immigrants from Japan and unemployment rate among males in the United States with a correlation coefficient (R) of 0.107 and weighted average of 4.9%, a difference of 17.2%.
Male Unemployment Correlation Summary
| Measurement | Mexican American Indian | Immigrants from Japan |
| Minimum | 0.80% | 2.4% |
| Maximum | 34.9% | 7.0% |
| Range | 34.1% | 4.6% |
| Mean | 7.2% | 4.3% |
| Median | 6.0% | 4.3% |
| Interquartile 25% (IQ1) | 4.4% | 3.8% |
| Interquartile 75% (IQ3) | 6.9% | 4.7% |
| Interquartile Range (IQR) | 2.5% | 0.88% |
| Standard Deviation (Sample) | 5.6% | 0.93% |
| Standard Deviation (Population) | 5.6% | 0.91% |
Similar Demographics by Male Unemployment
Demographics Similar to Mexican American Indians by Male Unemployment
In terms of male unemployment, the demographic groups most similar to Mexican American Indians are Mexican (5.8%, a difference of 0.13%), Japanese (5.8%, a difference of 0.17%), Kiowa (5.8%, a difference of 0.28%), Comanche (5.8%, a difference of 0.35%), and Hispanic or Latino (5.8%, a difference of 0.52%).
| Demographics | Rating | Rank | Male Unemployment |
| Iroquois | 0.6 /100 | #246 | Tragic 5.7% |
| Hawaiians | 0.6 /100 | #247 | Tragic 5.7% |
| Marshallese | 0.5 /100 | #248 | Tragic 5.7% |
| Cree | 0.4 /100 | #249 | Tragic 5.7% |
| Immigrants | Bahamas | 0.4 /100 | #250 | Tragic 5.7% |
| Spanish Americans | 0.3 /100 | #251 | Tragic 5.7% |
| Mexicans | 0.2 /100 | #252 | Tragic 5.8% |
| Mexican American Indians | 0.2 /100 | #253 | Tragic 5.8% |
| Japanese | 0.2 /100 | #254 | Tragic 5.8% |
| Kiowa | 0.2 /100 | #255 | Tragic 5.8% |
| Comanche | 0.2 /100 | #256 | Tragic 5.8% |
| Hispanics or Latinos | 0.1 /100 | #257 | Tragic 5.8% |
| Dutch West Indians | 0.1 /100 | #258 | Tragic 5.8% |
| Cajuns | 0.1 /100 | #259 | Tragic 5.8% |
| Immigrants | Central America | 0.1 /100 | #260 | Tragic 5.8% |
Demographics Similar to Immigrants from Japan by Male Unemployment
In terms of male unemployment, the demographic groups most similar to Immigrants from Japan are Immigrants from Belgium (4.9%, a difference of 0.10%), Chinese (4.9%, a difference of 0.13%), Immigrants from Korea (4.9%, a difference of 0.18%), Northern European (4.9%, a difference of 0.21%), and Burmese (4.9%, a difference of 0.29%).
| Demographics | Rating | Rank | Male Unemployment |
| Immigrants | Singapore | 99.4 /100 | #36 | Exceptional 4.9% |
| Scotch-Irish | 99.4 /100 | #37 | Exceptional 4.9% |
| Immigrants | Bosnia and Herzegovina | 99.4 /100 | #38 | Exceptional 4.9% |
| Burmese | 99.3 /100 | #39 | Exceptional 4.9% |
| Northern Europeans | 99.3 /100 | #40 | Exceptional 4.9% |
| Chinese | 99.3 /100 | #41 | Exceptional 4.9% |
| Immigrants | Belgium | 99.2 /100 | #42 | Exceptional 4.9% |
| Immigrants | Japan | 99.2 /100 | #43 | Exceptional 4.9% |
| Immigrants | Korea | 99.1 /100 | #44 | Exceptional 4.9% |
| Immigrants | Zimbabwe | 99.0 /100 | #45 | Exceptional 4.9% |
| Bhutanese | 98.9 /100 | #46 | Exceptional 4.9% |
| Austrians | 98.9 /100 | #47 | Exceptional 4.9% |
| Immigrants | Scotland | 98.9 /100 | #48 | Exceptional 4.9% |
| Poles | 98.9 /100 | #49 | Exceptional 4.9% |
| Croatians | 98.9 /100 | #50 | Exceptional 4.9% |