Menominee vs Iroquois Unemployment Among Women with Children Under 6 years
COMPARE
Menominee
Iroquois
Unemployment Among Women with Children Under 6 years
Unemployment Among Women with Children Under 6 years Comparison
Menominee
Iroquois
8.7%
UNEMPLOYMENT AMONG WOMEN WITH CHILDREN UNDER 6 YEARS
0.0/ 100
METRIC RATING
287th/ 347
METRIC RANK
8.7%
UNEMPLOYMENT AMONG WOMEN WITH CHILDREN UNDER 6 YEARS
0.0/ 100
METRIC RATING
289th/ 347
METRIC RANK
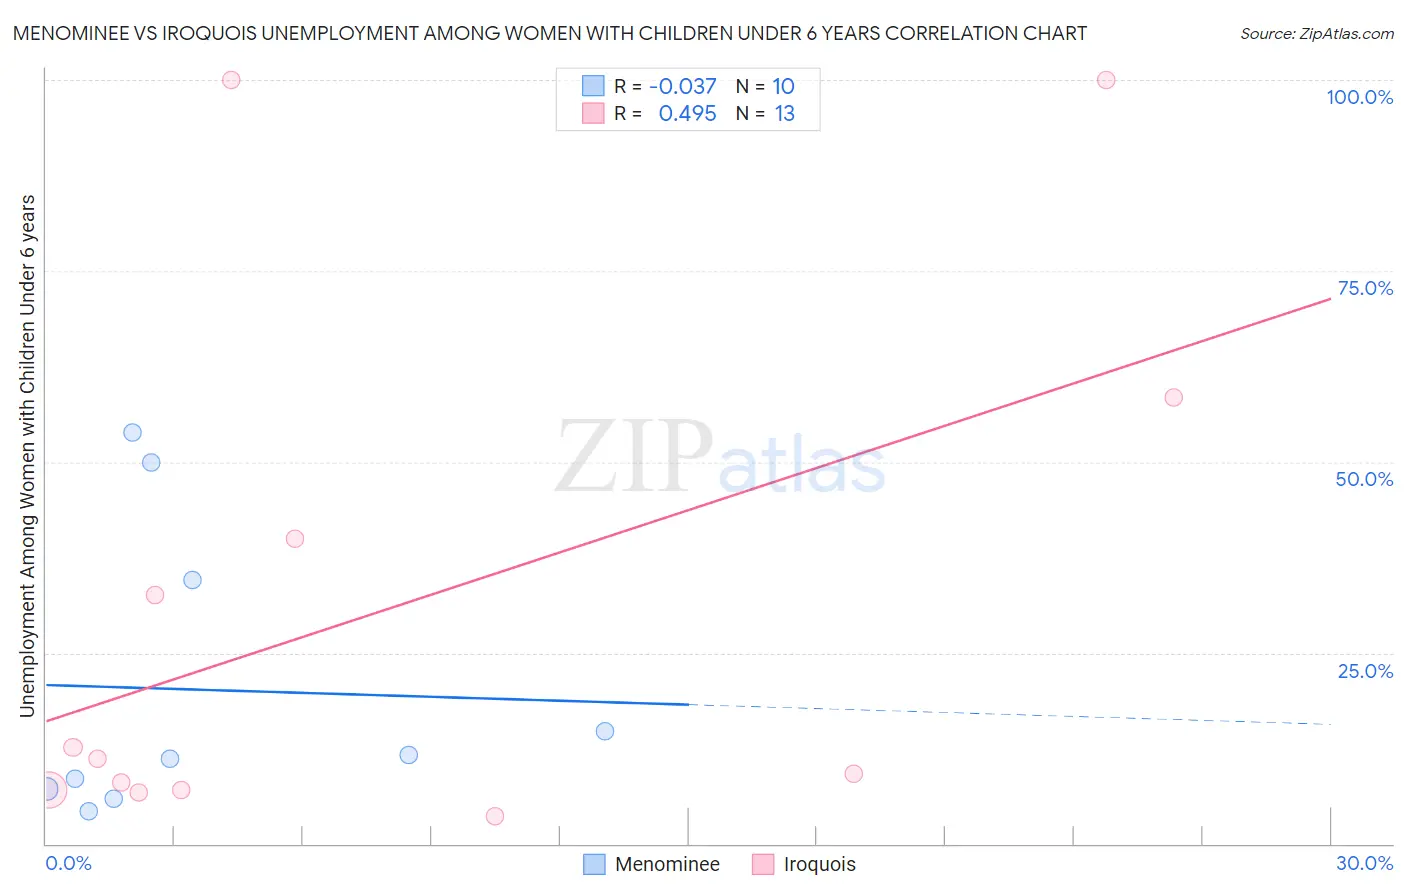
Menominee vs Iroquois Unemployment Among Women with Children Under 6 years Correlation Chart
The statistical analysis conducted on geographies consisting of 41,178,371 people shows no correlation between the proportion of Menominee and unemployment rate among women with children under the age of 6 in the United States with a correlation coefficient (R) of -0.037 and weighted average of 8.7%. Similarly, the statistical analysis conducted on geographies consisting of 170,660,150 people shows a moderate positive correlation between the proportion of Iroquois and unemployment rate among women with children under the age of 6 in the United States with a correlation coefficient (R) of 0.495 and weighted average of 8.7%, a difference of 0.31%.
Unemployment Among Women with Children Under 6 years Correlation Summary
| Measurement | Menominee | Iroquois |
| Minimum | 4.2% | 3.6% |
| Maximum | 53.8% | 100.0% |
| Range | 49.6% | 96.4% |
| Mean | 20.2% | 30.5% |
| Median | 11.3% | 11.2% |
| Interquartile 25% (IQ1) | 7.2% | 7.1% |
| Interquartile 75% (IQ3) | 34.6% | 49.2% |
| Interquartile Range (IQR) | 27.4% | 42.2% |
| Standard Deviation (Sample) | 18.8% | 34.9% |
| Standard Deviation (Population) | 17.8% | 33.5% |
Demographics Similar to Menominee and Iroquois by Unemployment Among Women with Children Under 6 years
In terms of unemployment among women with children under 6 years, the demographic groups most similar to Menominee are U.S. Virgin Islander (8.7%, a difference of 0.15%), Seminole (8.7%, a difference of 0.15%), Bahamian (8.7%, a difference of 0.20%), Blackfeet (8.7%, a difference of 0.35%), and Vietnamese (8.8%, a difference of 0.46%). Similarly, the demographic groups most similar to Iroquois are Bahamian (8.7%, a difference of 0.11%), Vietnamese (8.8%, a difference of 0.15%), U.S. Virgin Islander (8.7%, a difference of 0.46%), Seminole (8.7%, a difference of 0.46%), and Jamaican (8.8%, a difference of 0.59%).
| Demographics | Rating | Rank | Unemployment Among Women with Children Under 6 years |
| Immigrants | Dominica | 0.0 /100 | #278 | Tragic 8.6% |
| Immigrants | Guatemala | 0.0 /100 | #279 | Tragic 8.6% |
| Immigrants | Belize | 0.0 /100 | #280 | Tragic 8.6% |
| Guatemalans | 0.0 /100 | #281 | Tragic 8.7% |
| Bermudans | 0.0 /100 | #282 | Tragic 8.7% |
| Spanish American Indians | 0.0 /100 | #283 | Tragic 8.7% |
| Blackfeet | 0.0 /100 | #284 | Tragic 8.7% |
| U.S. Virgin Islanders | 0.0 /100 | #285 | Tragic 8.7% |
| Seminole | 0.0 /100 | #286 | Tragic 8.7% |
| Menominee | 0.0 /100 | #287 | Tragic 8.7% |
| Bahamians | 0.0 /100 | #288 | Tragic 8.7% |
| Iroquois | 0.0 /100 | #289 | Tragic 8.7% |
| Vietnamese | 0.0 /100 | #290 | Tragic 8.8% |
| Jamaicans | 0.0 /100 | #291 | Tragic 8.8% |
| Cheyenne | 0.0 /100 | #292 | Tragic 8.8% |
| Immigrants | Bangladesh | 0.0 /100 | #293 | Tragic 8.8% |
| Immigrants | Nonimmigrants | 0.0 /100 | #294 | Tragic 8.8% |
| Immigrants | Central America | 0.0 /100 | #295 | Tragic 8.9% |
| Immigrants | Dominican Republic | 0.0 /100 | #296 | Tragic 8.9% |
| Mexicans | 0.0 /100 | #297 | Tragic 8.9% |
| Tlingit-Haida | 0.0 /100 | #298 | Tragic 8.9% |