Menominee vs European Unemployment Among Ages 55 to 59 years
COMPARE
Menominee
European
Unemployment Among Ages 55 to 59 years
Unemployment Among Ages 55 to 59 years Comparison
Menominee
Europeans
10.5%
UNEMPLOYMENT AMONG AGES 55 TO 59 YEARS
0.0/ 100
METRIC RATING
346th/ 347
METRIC RANK
4.5%
UNEMPLOYMENT AMONG AGES 55 TO 59 YEARS
99.8/ 100
METRIC RATING
44th/ 347
METRIC RANK
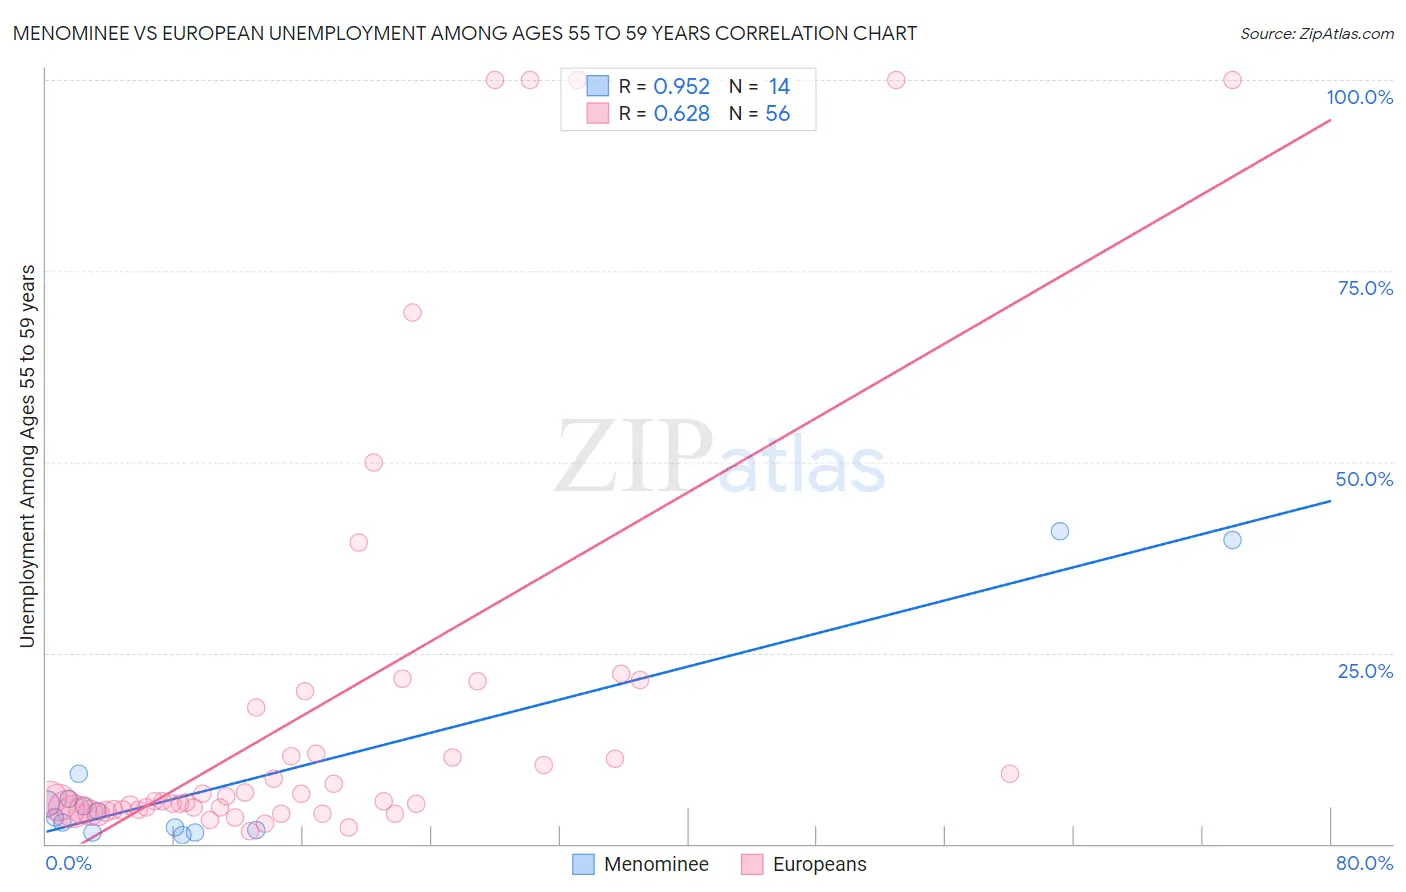
Menominee vs European Unemployment Among Ages 55 to 59 years Correlation Chart
The statistical analysis conducted on geographies consisting of 44,393,240 people shows a perfect positive correlation between the proportion of Menominee and unemployment rate among population between the ages 55 and 59 in the United States with a correlation coefficient (R) of 0.952 and weighted average of 10.5%. Similarly, the statistical analysis conducted on geographies consisting of 481,606,288 people shows a significant positive correlation between the proportion of Europeans and unemployment rate among population between the ages 55 and 59 in the United States with a correlation coefficient (R) of 0.628 and weighted average of 4.5%, a difference of 133.5%.
Unemployment Among Ages 55 to 59 years Correlation Summary
| Measurement | Menominee | European |
| Minimum | 1.1% | 1.7% |
| Maximum | 40.9% | 100.0% |
| Range | 39.8% | 98.3% |
| Mean | 8.9% | 18.3% |
| Median | 3.9% | 5.6% |
| Interquartile 25% (IQ1) | 1.8% | 4.5% |
| Interquartile 75% (IQ3) | 5.9% | 14.8% |
| Interquartile Range (IQR) | 4.1% | 10.3% |
| Standard Deviation (Sample) | 13.5% | 28.4% |
| Standard Deviation (Population) | 13.0% | 28.2% |
Similar Demographics by Unemployment Among Ages 55 to 59 years
Demographics Similar to Menominee by Unemployment Among Ages 55 to 59 years
In terms of unemployment among ages 55 to 59 years, the demographic groups most similar to Menominee are Tohono O'odham (9.3%, a difference of 13.1%), Inupiat (9.0%, a difference of 16.6%), Yakama (8.9%, a difference of 18.0%), Hopi (8.1%, a difference of 29.8%), and Yup'ik (13.9%, a difference of 32.2%).
| Demographics | Rating | Rank | Unemployment Among Ages 55 to 59 years |
| Pima | 0.0 /100 | #333 | Tragic 6.6% |
| Pueblo | 0.0 /100 | #334 | Tragic 6.7% |
| Colville | 0.0 /100 | #335 | Tragic 6.7% |
| Navajo | 0.0 /100 | #336 | Tragic 6.7% |
| Paiute | 0.0 /100 | #337 | Tragic 6.8% |
| Immigrants | Yemen | 0.0 /100 | #338 | Tragic 6.9% |
| Puerto Ricans | 0.0 /100 | #339 | Tragic 7.0% |
| Alaskan Athabascans | 0.0 /100 | #340 | Tragic 7.1% |
| Shoshone | 0.0 /100 | #341 | Tragic 7.4% |
| Hopi | 0.0 /100 | #342 | Tragic 8.1% |
| Yakama | 0.0 /100 | #343 | Tragic 8.9% |
| Inupiat | 0.0 /100 | #344 | Tragic 9.0% |
| Tohono O'odham | 0.0 /100 | #345 | Tragic 9.3% |
| Menominee | 0.0 /100 | #346 | Tragic 10.5% |
| Yup'ik | 0.0 /100 | #347 | Tragic 13.9% |
Demographics Similar to Europeans by Unemployment Among Ages 55 to 59 years
In terms of unemployment among ages 55 to 59 years, the demographic groups most similar to Europeans are Immigrants from Korea (4.5%, a difference of 0.0%), Immigrants from Kuwait (4.5%, a difference of 0.040%), Luxembourger (4.5%, a difference of 0.070%), British (4.5%, a difference of 0.070%), and Swiss (4.5%, a difference of 0.080%).
| Demographics | Rating | Rank | Unemployment Among Ages 55 to 59 years |
| Immigrants | Bulgaria | 99.9 /100 | #37 | Exceptional 4.5% |
| Assyrians/Chaldeans/Syriacs | 99.9 /100 | #38 | Exceptional 4.5% |
| English | 99.9 /100 | #39 | Exceptional 4.5% |
| Swiss | 99.8 /100 | #40 | Exceptional 4.5% |
| Luxembourgers | 99.8 /100 | #41 | Exceptional 4.5% |
| Immigrants | Kuwait | 99.8 /100 | #42 | Exceptional 4.5% |
| Immigrants | Korea | 99.8 /100 | #43 | Exceptional 4.5% |
| Europeans | 99.8 /100 | #44 | Exceptional 4.5% |
| British | 99.8 /100 | #45 | Exceptional 4.5% |
| Immigrants | Zaire | 99.8 /100 | #46 | Exceptional 4.5% |
| German Russians | 99.8 /100 | #47 | Exceptional 4.5% |
| Immigrants | Moldova | 99.7 /100 | #48 | Exceptional 4.5% |
| Immigrants | Saudi Arabia | 99.7 /100 | #49 | Exceptional 4.5% |
| Immigrants | Pakistan | 99.7 /100 | #50 | Exceptional 4.5% |
| Maltese | 99.7 /100 | #51 | Exceptional 4.5% |