Immigrants from Jordan vs European Unemployment Among Ages 55 to 59 years
COMPARE
Immigrants from Jordan
European
Unemployment Among Ages 55 to 59 years
Unemployment Among Ages 55 to 59 years Comparison
Immigrants from Jordan
Europeans
4.6%
UNEMPLOYMENT AMONG AGES 55 TO 59 YEARS
98.7/ 100
METRIC RATING
71st/ 347
METRIC RANK
4.5%
UNEMPLOYMENT AMONG AGES 55 TO 59 YEARS
99.8/ 100
METRIC RATING
44th/ 347
METRIC RANK
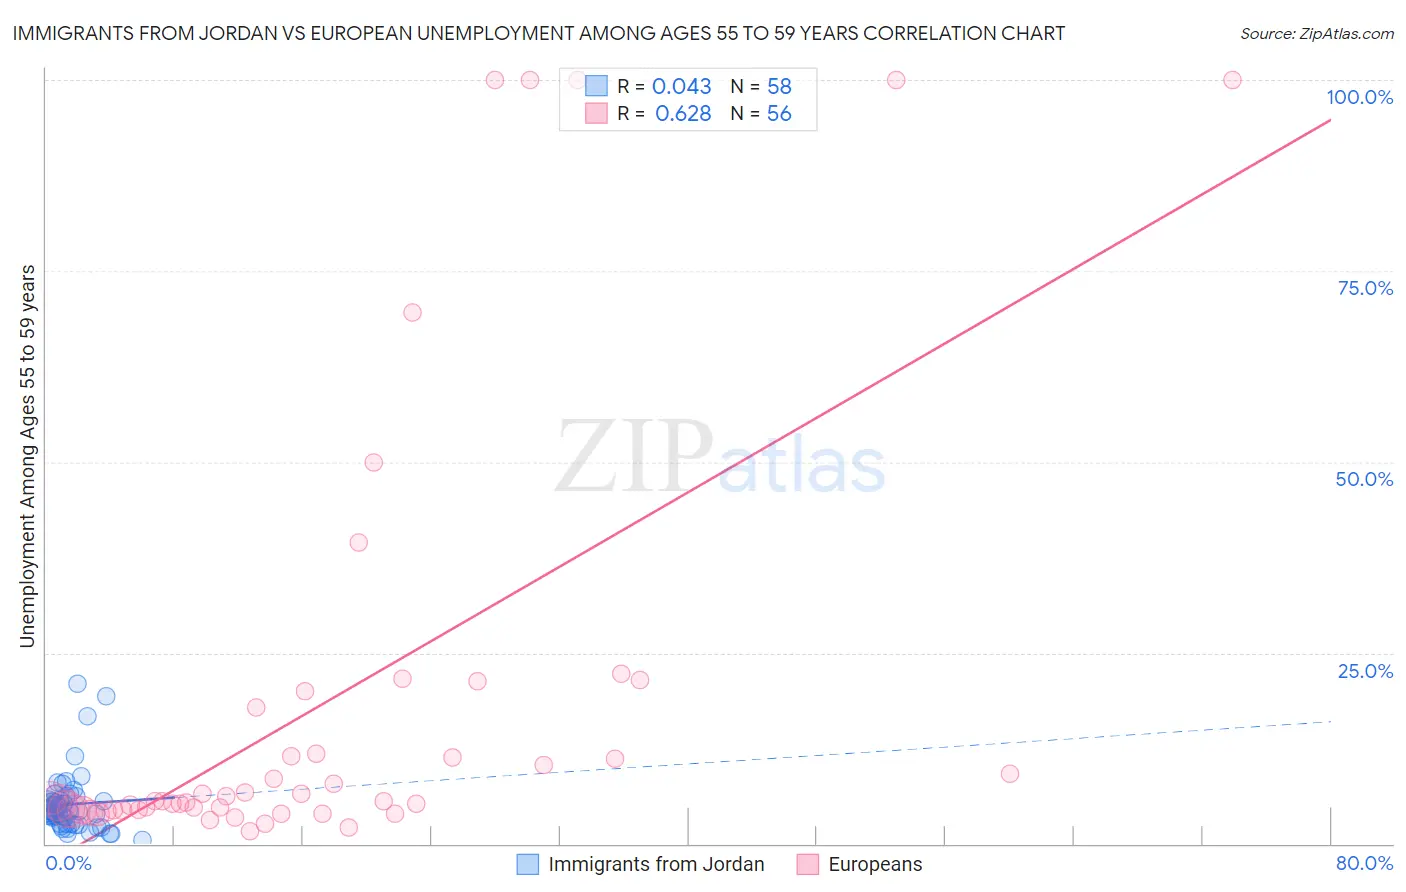
Immigrants from Jordan vs European Unemployment Among Ages 55 to 59 years Correlation Chart
The statistical analysis conducted on geographies consisting of 176,295,369 people shows no correlation between the proportion of Immigrants from Jordan and unemployment rate among population between the ages 55 and 59 in the United States with a correlation coefficient (R) of 0.043 and weighted average of 4.6%. Similarly, the statistical analysis conducted on geographies consisting of 481,606,288 people shows a significant positive correlation between the proportion of Europeans and unemployment rate among population between the ages 55 and 59 in the United States with a correlation coefficient (R) of 0.628 and weighted average of 4.5%, a difference of 2.0%.
Unemployment Among Ages 55 to 59 years Correlation Summary
| Measurement | Immigrants from Jordan | European |
| Minimum | 0.50% | 1.7% |
| Maximum | 21.0% | 100.0% |
| Range | 20.5% | 98.3% |
| Mean | 5.1% | 18.3% |
| Median | 4.4% | 5.6% |
| Interquartile 25% (IQ1) | 2.6% | 4.5% |
| Interquartile 75% (IQ3) | 5.6% | 14.8% |
| Interquartile Range (IQR) | 3.0% | 10.3% |
| Standard Deviation (Sample) | 3.9% | 28.4% |
| Standard Deviation (Population) | 3.9% | 28.2% |
Similar Demographics by Unemployment Among Ages 55 to 59 years
Demographics Similar to Immigrants from Jordan by Unemployment Among Ages 55 to 59 years
In terms of unemployment among ages 55 to 59 years, the demographic groups most similar to Immigrants from Jordan are Filipino (4.6%, a difference of 0.030%), Immigrants from Taiwan (4.6%, a difference of 0.040%), Bhutanese (4.6%, a difference of 0.11%), Croatian (4.6%, a difference of 0.19%), and Immigrants from Iraq (4.6%, a difference of 0.21%).
| Demographics | Rating | Rank | Unemployment Among Ages 55 to 59 years |
| Argentineans | 99.1 /100 | #64 | Exceptional 4.6% |
| Sudanese | 99.1 /100 | #65 | Exceptional 4.6% |
| Mongolians | 99.0 /100 | #66 | Exceptional 4.6% |
| Ugandans | 99.0 /100 | #67 | Exceptional 4.6% |
| Immigrants | Micronesia | 99.0 /100 | #68 | Exceptional 4.6% |
| Czechoslovakians | 99.0 /100 | #69 | Exceptional 4.6% |
| Filipinos | 98.8 /100 | #70 | Exceptional 4.6% |
| Immigrants | Jordan | 98.7 /100 | #71 | Exceptional 4.6% |
| Immigrants | Taiwan | 98.7 /100 | #72 | Exceptional 4.6% |
| Bhutanese | 98.6 /100 | #73 | Exceptional 4.6% |
| Croatians | 98.5 /100 | #74 | Exceptional 4.6% |
| Immigrants | Iraq | 98.5 /100 | #75 | Exceptional 4.6% |
| Immigrants | Bosnia and Herzegovina | 98.3 /100 | #76 | Exceptional 4.6% |
| Scotch-Irish | 98.3 /100 | #77 | Exceptional 4.6% |
| Finns | 98.2 /100 | #78 | Exceptional 4.6% |
Demographics Similar to Europeans by Unemployment Among Ages 55 to 59 years
In terms of unemployment among ages 55 to 59 years, the demographic groups most similar to Europeans are Immigrants from Korea (4.5%, a difference of 0.0%), Immigrants from Kuwait (4.5%, a difference of 0.040%), Luxembourger (4.5%, a difference of 0.070%), British (4.5%, a difference of 0.070%), and Swiss (4.5%, a difference of 0.080%).
| Demographics | Rating | Rank | Unemployment Among Ages 55 to 59 years |
| Immigrants | Bulgaria | 99.9 /100 | #37 | Exceptional 4.5% |
| Assyrians/Chaldeans/Syriacs | 99.9 /100 | #38 | Exceptional 4.5% |
| English | 99.9 /100 | #39 | Exceptional 4.5% |
| Swiss | 99.8 /100 | #40 | Exceptional 4.5% |
| Luxembourgers | 99.8 /100 | #41 | Exceptional 4.5% |
| Immigrants | Kuwait | 99.8 /100 | #42 | Exceptional 4.5% |
| Immigrants | Korea | 99.8 /100 | #43 | Exceptional 4.5% |
| Europeans | 99.8 /100 | #44 | Exceptional 4.5% |
| British | 99.8 /100 | #45 | Exceptional 4.5% |
| Immigrants | Zaire | 99.8 /100 | #46 | Exceptional 4.5% |
| German Russians | 99.8 /100 | #47 | Exceptional 4.5% |
| Immigrants | Moldova | 99.7 /100 | #48 | Exceptional 4.5% |
| Immigrants | Saudi Arabia | 99.7 /100 | #49 | Exceptional 4.5% |
| Immigrants | Pakistan | 99.7 /100 | #50 | Exceptional 4.5% |
| Maltese | 99.7 /100 | #51 | Exceptional 4.5% |