Marshallese vs Immigrants from Pakistan Female Unemployment
COMPARE
Marshallese
Immigrants from Pakistan
Female Unemployment
Female Unemployment Comparison
Marshallese
Immigrants from Pakistan
5.6%
FEMALE UNEMPLOYMENT
2.3/ 100
METRIC RATING
242nd/ 347
METRIC RANK
5.2%
FEMALE UNEMPLOYMENT
66.7/ 100
METRIC RATING
161st/ 347
METRIC RANK
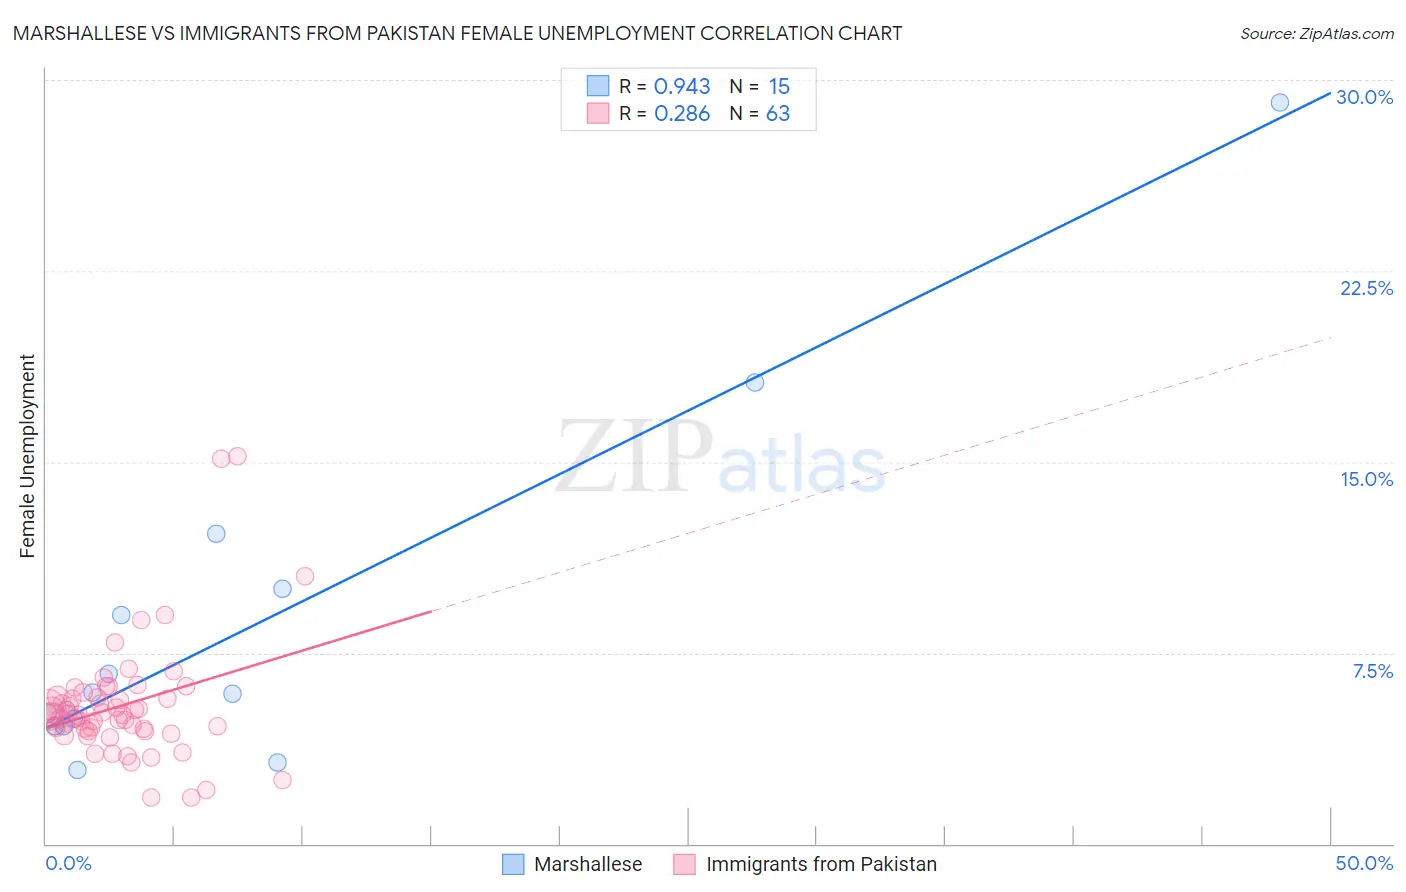
Marshallese vs Immigrants from Pakistan Female Unemployment Correlation Chart
The statistical analysis conducted on geographies consisting of 14,756,789 people shows a near-perfect positive correlation between the proportion of Marshallese and unemploymnet rate among females in the United States with a correlation coefficient (R) of 0.943 and weighted average of 5.6%. Similarly, the statistical analysis conducted on geographies consisting of 283,425,131 people shows a weak positive correlation between the proportion of Immigrants from Pakistan and unemploymnet rate among females in the United States with a correlation coefficient (R) of 0.286 and weighted average of 5.2%, a difference of 6.8%.
Female Unemployment Correlation Summary
| Measurement | Marshallese | Immigrants from Pakistan |
| Minimum | 2.9% | 1.8% |
| Maximum | 29.1% | 15.2% |
| Range | 26.2% | 13.4% |
| Mean | 8.5% | 5.4% |
| Median | 5.9% | 5.0% |
| Interquartile 25% (IQ1) | 4.6% | 4.4% |
| Interquartile 75% (IQ3) | 10.0% | 5.8% |
| Interquartile Range (IQR) | 5.4% | 1.4% |
| Standard Deviation (Sample) | 6.9% | 2.3% |
| Standard Deviation (Population) | 6.7% | 2.3% |
Similar Demographics by Female Unemployment
Demographics Similar to Marshallese by Female Unemployment
In terms of female unemployment, the demographic groups most similar to Marshallese are Spanish American (5.6%, a difference of 0.010%), South American Indian (5.5%, a difference of 0.32%), Immigrants from South America (5.5%, a difference of 0.37%), Aleut (5.5%, a difference of 0.40%), and Sierra Leonean (5.5%, a difference of 0.50%).
| Demographics | Rating | Rank | Female Unemployment |
| Immigrants | Iran | 3.3 /100 | #235 | Tragic 5.5% |
| Immigrants | Cambodia | 3.3 /100 | #236 | Tragic 5.5% |
| Immigrants | Panama | 3.2 /100 | #237 | Tragic 5.5% |
| Sierra Leoneans | 3.2 /100 | #238 | Tragic 5.5% |
| Aleuts | 3.0 /100 | #239 | Tragic 5.5% |
| Immigrants | South America | 2.9 /100 | #240 | Tragic 5.5% |
| South American Indians | 2.8 /100 | #241 | Tragic 5.5% |
| Marshallese | 2.3 /100 | #242 | Tragic 5.6% |
| Spanish Americans | 2.2 /100 | #243 | Tragic 5.6% |
| Immigrants | Liberia | 1.5 /100 | #244 | Tragic 5.6% |
| Guamanians/Chamorros | 1.4 /100 | #245 | Tragic 5.6% |
| Japanese | 1.2 /100 | #246 | Tragic 5.6% |
| Immigrants | Western Asia | 1.1 /100 | #247 | Tragic 5.6% |
| Cree | 1.0 /100 | #248 | Tragic 5.6% |
| Immigrants | Uzbekistan | 1.0 /100 | #249 | Tragic 5.6% |
Demographics Similar to Immigrants from Pakistan by Female Unemployment
In terms of female unemployment, the demographic groups most similar to Immigrants from Pakistan are Immigrants from Spain (5.2%, a difference of 0.0%), Immigrants from Micronesia (5.2%, a difference of 0.010%), Potawatomi (5.2%, a difference of 0.050%), Albanian (5.2%, a difference of 0.11%), and Immigrants from Asia (5.2%, a difference of 0.16%).
| Demographics | Rating | Rank | Female Unemployment |
| South Africans | 70.8 /100 | #154 | Good 5.2% |
| Immigrants | Egypt | 70.0 /100 | #155 | Good 5.2% |
| Immigrants | Northern Africa | 69.6 /100 | #156 | Good 5.2% |
| Immigrants | Russia | 69.3 /100 | #157 | Good 5.2% |
| Albanians | 68.3 /100 | #158 | Good 5.2% |
| Immigrants | Micronesia | 66.9 /100 | #159 | Good 5.2% |
| Immigrants | Spain | 66.8 /100 | #160 | Good 5.2% |
| Immigrants | Pakistan | 66.7 /100 | #161 | Good 5.2% |
| Potawatomi | 65.9 /100 | #162 | Good 5.2% |
| Immigrants | Asia | 64.3 /100 | #163 | Good 5.2% |
| Bangladeshis | 64.3 /100 | #164 | Good 5.2% |
| Syrians | 62.8 /100 | #165 | Good 5.2% |
| Native Hawaiians | 62.7 /100 | #166 | Good 5.2% |
| Immigrants | Thailand | 62.1 /100 | #167 | Good 5.2% |
| Sri Lankans | 59.4 /100 | #168 | Average 5.2% |