Marshallese vs Immigrants from Bahamas Female Unemployment
COMPARE
Marshallese
Immigrants from Bahamas
Female Unemployment
Female Unemployment Comparison
Marshallese
Immigrants from Bahamas
5.6%
FEMALE UNEMPLOYMENT
2.3/ 100
METRIC RATING
242nd/ 347
METRIC RANK
5.8%
FEMALE UNEMPLOYMENT
0.1/ 100
METRIC RATING
264th/ 347
METRIC RANK
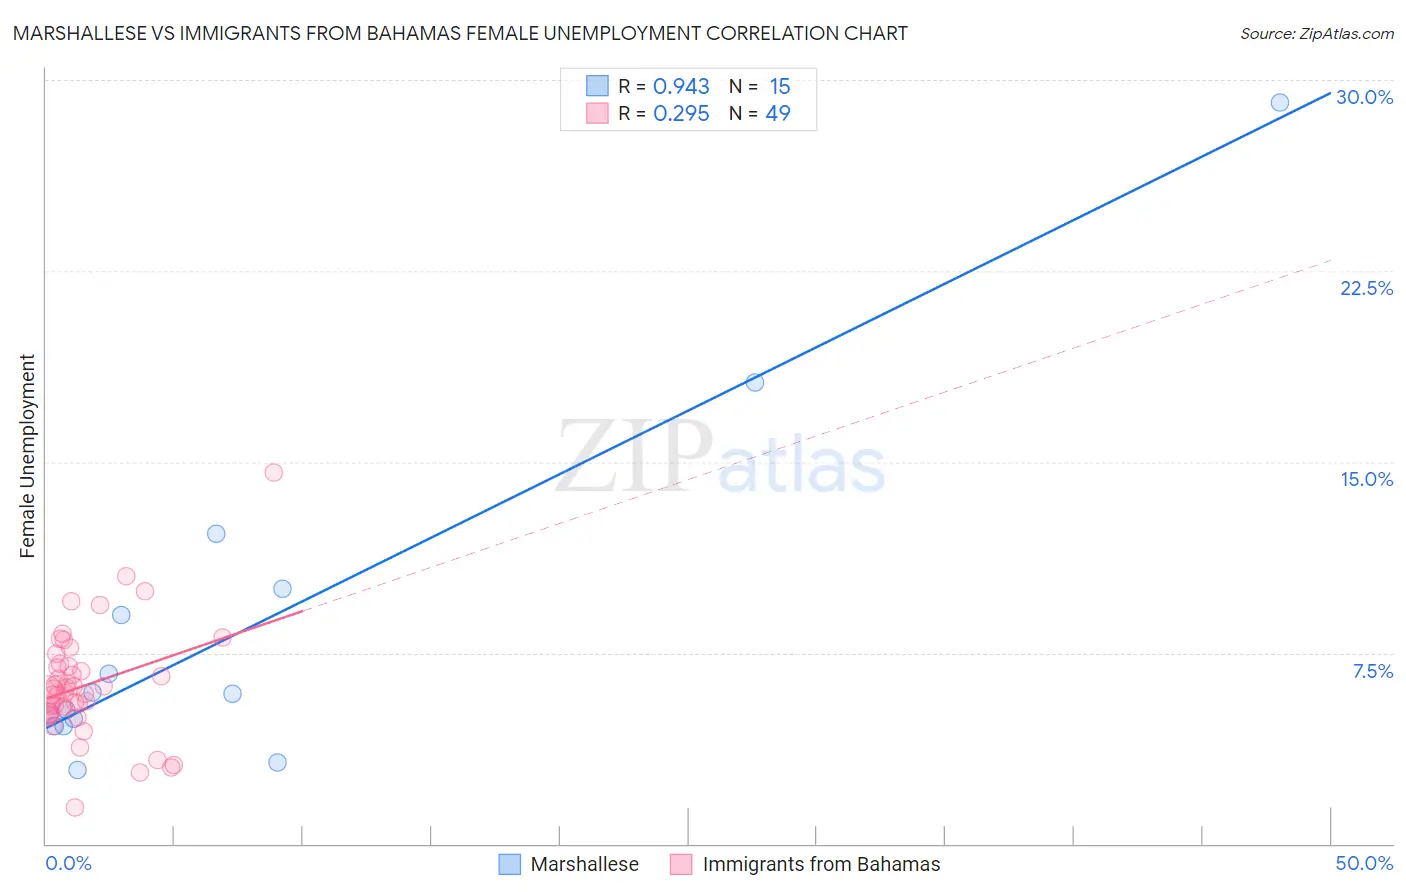
Marshallese vs Immigrants from Bahamas Female Unemployment Correlation Chart
The statistical analysis conducted on geographies consisting of 14,756,789 people shows a near-perfect positive correlation between the proportion of Marshallese and unemploymnet rate among females in the United States with a correlation coefficient (R) of 0.943 and weighted average of 5.6%. Similarly, the statistical analysis conducted on geographies consisting of 104,550,633 people shows a weak positive correlation between the proportion of Immigrants from Bahamas and unemploymnet rate among females in the United States with a correlation coefficient (R) of 0.295 and weighted average of 5.8%, a difference of 5.1%.
Female Unemployment Correlation Summary
| Measurement | Marshallese | Immigrants from Bahamas |
| Minimum | 2.9% | 1.4% |
| Maximum | 29.1% | 14.6% |
| Range | 26.2% | 13.2% |
| Mean | 8.5% | 6.2% |
| Median | 5.9% | 5.9% |
| Interquartile 25% (IQ1) | 4.6% | 5.1% |
| Interquartile 75% (IQ3) | 10.0% | 7.0% |
| Interquartile Range (IQR) | 5.4% | 1.9% |
| Standard Deviation (Sample) | 6.9% | 2.2% |
| Standard Deviation (Population) | 6.7% | 2.2% |
Similar Demographics by Female Unemployment
Demographics Similar to Marshallese by Female Unemployment
In terms of female unemployment, the demographic groups most similar to Marshallese are Spanish American (5.6%, a difference of 0.010%), South American Indian (5.5%, a difference of 0.32%), Immigrants from South America (5.5%, a difference of 0.37%), Aleut (5.5%, a difference of 0.40%), and Sierra Leonean (5.5%, a difference of 0.50%).
| Demographics | Rating | Rank | Female Unemployment |
| Immigrants | Iran | 3.3 /100 | #235 | Tragic 5.5% |
| Immigrants | Cambodia | 3.3 /100 | #236 | Tragic 5.5% |
| Immigrants | Panama | 3.2 /100 | #237 | Tragic 5.5% |
| Sierra Leoneans | 3.2 /100 | #238 | Tragic 5.5% |
| Aleuts | 3.0 /100 | #239 | Tragic 5.5% |
| Immigrants | South America | 2.9 /100 | #240 | Tragic 5.5% |
| South American Indians | 2.8 /100 | #241 | Tragic 5.5% |
| Marshallese | 2.3 /100 | #242 | Tragic 5.6% |
| Spanish Americans | 2.2 /100 | #243 | Tragic 5.6% |
| Immigrants | Liberia | 1.5 /100 | #244 | Tragic 5.6% |
| Guamanians/Chamorros | 1.4 /100 | #245 | Tragic 5.6% |
| Japanese | 1.2 /100 | #246 | Tragic 5.6% |
| Immigrants | Western Asia | 1.1 /100 | #247 | Tragic 5.6% |
| Cree | 1.0 /100 | #248 | Tragic 5.6% |
| Immigrants | Uzbekistan | 1.0 /100 | #249 | Tragic 5.6% |
Demographics Similar to Immigrants from Bahamas by Female Unemployment
In terms of female unemployment, the demographic groups most similar to Immigrants from Bahamas are Immigrants from the Azores (5.8%, a difference of 0.39%), Blackfeet (5.9%, a difference of 0.40%), Cape Verdean (5.9%, a difference of 0.68%), Nepalese (5.9%, a difference of 0.79%), and Honduran (5.9%, a difference of 0.89%).
| Demographics | Rating | Rank | Female Unemployment |
| Dutch West Indians | 0.3 /100 | #257 | Tragic 5.7% |
| Immigrants | Portugal | 0.2 /100 | #258 | Tragic 5.8% |
| Immigrants | Fiji | 0.2 /100 | #259 | Tragic 5.8% |
| Nigerians | 0.2 /100 | #260 | Tragic 5.8% |
| Kiowa | 0.1 /100 | #261 | Tragic 5.8% |
| Immigrants | Nigeria | 0.1 /100 | #262 | Tragic 5.8% |
| Immigrants | Azores | 0.1 /100 | #263 | Tragic 5.8% |
| Immigrants | Bahamas | 0.1 /100 | #264 | Tragic 5.8% |
| Blackfeet | 0.0 /100 | #265 | Tragic 5.9% |
| Cape Verdeans | 0.0 /100 | #266 | Tragic 5.9% |
| Nepalese | 0.0 /100 | #267 | Tragic 5.9% |
| Hondurans | 0.0 /100 | #268 | Tragic 5.9% |
| Immigrants | Western Africa | 0.0 /100 | #269 | Tragic 5.9% |
| Immigrants | Honduras | 0.0 /100 | #270 | Tragic 5.9% |
| Central Americans | 0.0 /100 | #271 | Tragic 5.9% |