Maltese vs Immigrants from Syria Male Unemployment

COMPARE

Maltese
Race
Ancestry
AfghanAfricanAlaska NativeAlaskan AthabascanAlbanianAleutAlsatianAmericanApacheArabArapahoArgentineanArmenianAssyrian/Chaldean/SyriacAustralianAustrianBahamianBangladeshiBarbadianBasqueBelgianBelizeanBermudanBhutaneseBlackfeetBolivianBrazilianBritishBritish West IndianBulgarianBurmeseCajunCambodianCanadianCape VerdeanCarpatho RusynCelticCentral AmericanCentral American IndianCherokeeCheyenneChickasawChileanChineseChippewaChoctawColombianColvilleComancheCosta RicanCreeCreekCroatianCrowCubanCypriotCzechCzechoslovakianDanishDelawareDominicanDutchDutch West IndianEastern EuropeanEcuadorianEgyptianEnglishEstonianEthiopianEuropeanFijianFilipinoFinnishFrenchFrench American IndianFrench CanadianGermanGerman RussianGhanaianGreekGuamanian/ChamorroGuatemalanGuyaneseHaitianHmongHonduranHopiHoumaHungarianIcelanderIndian (Asian)IndonesianInupiatIranianIraqiIrishIroquoisIsraeliItalianJamaicanJapaneseJordanianKenyanKiowaKoreanLaotianLatvianLebaneseLiberianLithuanianLumbeeLuxembourgerMacedonianMalaysianMalteseMarshalleseMenomineeMexicanMexican American IndianMongolianMoroccanNative HawaiianNavajoNepaleseNew ZealanderNicaraguanNigerianNorthern EuropeanNorwegianOkinawanOsageOttawaPaiutePakistaniPalestinianPanamanianParaguayanPennsylvania GermanPeruvianPimaPolishPortuguesePotawatomiPuebloPuerto RicanPuget Sound SalishRomanianRussianSalvadoranSamoanScandinavianScotch-IrishScottishSeminoleSenegaleseSerbianShoshoneSierra LeoneanSiouxSlavicSlovakSloveneSomaliSouth AfricanSouth AmericanSouth American IndianSoviet UnionSpaniardSpanishSpanish AmericanSpanish American IndianSri LankanSubsaharan AfricanSudaneseSwedishSwissSyrianTaiwaneseThaiTlingit-HaidaTohono O'OdhamTonganTrinidadian and TobagonianTsimshianTurkishU.S. Virgin IslanderUgandanUkrainianUruguayanUteVenezuelanVietnameseWelshWest IndianYakamaYaquiYugoslavianYumanYup'ikZimbabwean
Immigration
NonimmigrantsImmigrantsAfghanistanAfricaAlbaniaArgentinaArmeniaAsiaAustraliaAustriaBahamasBangladeshBarbadosBelarusBelgiumBelizeBoliviaBosnia and HerzegovinaBrazilBulgariaBurma/MyanmarCabo VerdeCambodiaCameroonCanadaCaribbeanCentral AmericaChileChinaColombiaCongoCosta RicaCroatiaCubaCzechoslovakiaDenmarkDominicaDominican RepublicEastern AfricaEastern AsiaEastern EuropeEcuadorEgyptEl SalvadorEnglandEritreaEthiopiaEuropeFijiFranceGermanyGhanaGreeceGrenadaGuatemalaGuyanaHaitiHondurasHong KongHungaryIndiaIndonesiaIranIraqIrelandIsraelItalyJamaicaJapanJordanKazakhstanKenyaKoreaKuwaitLaosLatin AmericaLatviaLebanonLiberiaLithuaniaMalaysiaMexicoMicronesiaMiddle AfricaMoldovaMoroccoNepalNetherlandsNicaraguaNigeriaNorth AmericaNorth MacedoniaNorthern AfricaNorthern EuropeNorwayOceaniaPakistanPanamaPeruPhilippinesPolandPortugalRomaniaRussiaSaudi ArabiaScotlandSenegalSerbiaSierra LeoneSingaporeSomaliaSouth AfricaSouth AmericaSouth Central AsiaSouth Eastern AsiaSouthern EuropeSpainSri LankaSt. Vincent and the GrenadinesSudanSwedenSwitzerlandTaiwanThailandTrinidad and TobagoTurkeyUgandaUkraineUruguayUzbekistanVenezuelaVietnamWest IndiesWestern AfricaWestern AsiaWestern EuropeYemenZaireZimbabweAzores
Immigrants from Syria
Race
Ancestry
AfghanAfricanAlaska NativeAlaskan AthabascanAlbanianAleutAlsatianAmericanApacheArabArapahoArgentineanArmenianAssyrian/Chaldean/SyriacAustralianAustrianBahamianBangladeshiBarbadianBasqueBelgianBelizeanBermudanBhutaneseBlackfeetBolivianBrazilianBritishBritish West IndianBulgarianBurmeseCajunCambodianCanadianCape VerdeanCarpatho RusynCelticCentral AmericanCentral American IndianCherokeeCheyenneChickasawChileanChineseChippewaChoctawColombianColvilleComancheCosta RicanCreeCreekCroatianCrowCubanCypriotCzechCzechoslovakianDanishDelawareDominicanDutchDutch West IndianEastern EuropeanEcuadorianEgyptianEnglishEstonianEthiopianEuropeanFijianFilipinoFinnishFrenchFrench American IndianFrench CanadianGermanGerman RussianGhanaianGreekGuamanian/ChamorroGuatemalanGuyaneseHaitianHmongHonduranHopiHoumaHungarianIcelanderIndian (Asian)IndonesianInupiatIranianIraqiIrishIroquoisIsraeliItalianJamaicanJapaneseJordanianKenyanKiowaKoreanLaotianLatvianLebaneseLiberianLithuanianLumbeeLuxembourgerMacedonianMalaysianMarshalleseMenomineeMexicanMexican American IndianMongolianMoroccanNative HawaiianNavajoNepaleseNew ZealanderNicaraguanNigerianNorthern EuropeanNorwegianOkinawanOsageOttawaPaiutePakistaniPalestinianPanamanianParaguayanPennsylvania GermanPeruvianPimaPolishPortuguesePotawatomiPuebloPuerto RicanPuget Sound SalishRomanianRussianSalvadoranSamoanScandinavianScotch-IrishScottishSeminoleSenegaleseSerbianShoshoneSierra LeoneanSiouxSlavicSlovakSloveneSomaliSouth AfricanSouth AmericanSouth American IndianSoviet UnionSpaniardSpanishSpanish AmericanSpanish American IndianSri LankanSubsaharan AfricanSudaneseSwedishSwissSyrianTaiwaneseThaiTlingit-HaidaTohono O'OdhamTonganTrinidadian and TobagonianTsimshianTurkishU.S. Virgin IslanderUgandanUkrainianUruguayanUteVenezuelanVietnameseWelshWest IndianYakamaYaquiYugoslavianYumanYup'ikZimbabwean
Immigration
NonimmigrantsImmigrantsAfghanistanAfricaAlbaniaArgentinaArmeniaAsiaAustraliaAustriaBahamasBangladeshBarbadosBelarusBelgiumBelizeBoliviaBosnia and HerzegovinaBrazilBulgariaBurma/MyanmarCabo VerdeCambodiaCameroonCanadaCaribbeanCentral AmericaChileChinaColombiaCongoCosta RicaCroatiaCubaCzechoslovakiaDenmarkDominicaDominican RepublicEastern AfricaEastern AsiaEastern EuropeEcuadorEgyptEl SalvadorEnglandEritreaEthiopiaEuropeFijiFranceGermanyGhanaGreeceGrenadaGuatemalaGuyanaHaitiHondurasHong KongHungaryIndiaIndonesiaIranIraqIrelandIsraelItalyJamaicaJapanJordanKazakhstanKenyaKoreaKuwaitLaosLatin AmericaLatviaLebanonLiberiaLithuaniaMalaysiaMexicoMicronesiaMiddle AfricaMoldovaMoroccoNepalNetherlandsNicaraguaNigeriaNorth AmericaNorth MacedoniaNorthern AfricaNorthern EuropeNorwayOceaniaPakistanPanamaPeruPhilippinesPolandPortugalRomaniaRussiaSaudi ArabiaScotlandSenegalSerbiaSierra LeoneSingaporeSomaliaSouth AfricaSouth AmericaSouth Central AsiaSouth Eastern AsiaSouthern EuropeSpainSri LankaSt. Vincent and the GrenadinesSudanSwedenSwitzerlandSyriaTaiwanThailandTrinidad and TobagoTurkeyUgandaUkraineUruguayUzbekistanVenezuelaVietnamWest IndiesWestern AfricaWestern AsiaWestern EuropeYemenZaireZimbabweAzores
Male Unemployment
Income
Poverty
Unemployment
Labor Participation
Family Structure
Vehicle Availability
Education Level
Disability

Male Unemployment Comparison

Maltese

Immigrants from Syria

Exceptional
Tragic
5.1%
MALE UNEMPLOYMENT
95.5/ 100
METRIC RATING
86th/ 347
METRIC RANK
5.5%
MALE UNEMPLOYMENT
9.3/ 100
METRIC RATING
207th/ 347
METRIC RANK

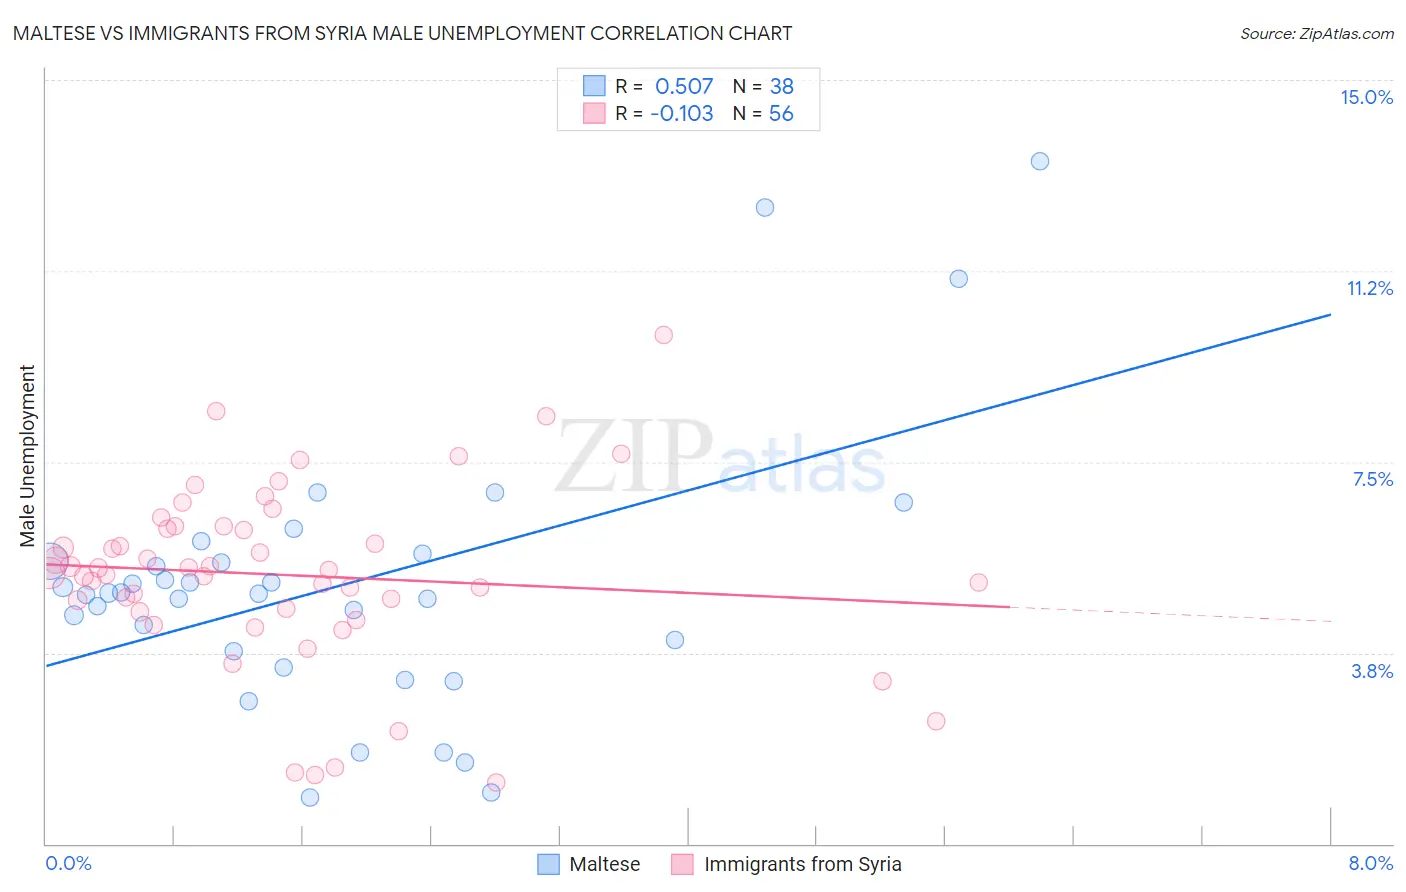
Maltese vs Immigrants from Syria Male Unemployment Correlation Chart

The statistical analysis conducted on geographies consisting of 126,309,580 people shows a substantial positive correlation between the proportion of Maltese and unemployment rate among males in the United States with a correlation coefficient (R) of 0.507 and weighted average of 5.1%. Similarly, the statistical analysis conducted on geographies consisting of 173,829,424 people shows a poor negative correlation between the proportion of Immigrants from Syria and unemployment rate among males in the United States with a correlation coefficient (R) of -0.103 and weighted average of 5.5%, a difference of 8.1%.
Maltese vs Immigrants from Syria Male Unemployment

Male Unemployment Correlation Summary

MeasurementMalteseImmigrants from Syria
Minimum0.90%1.2%
Maximum13.4%10.0%
Range12.5%8.8%
Mean5.1%5.3%
Median4.9%5.4%
Interquartile 25% (IQ1)3.8%4.6%
Interquartile 75% (IQ3)5.5%6.2%
Interquartile Range (IQR)1.8%1.6%
Standard Deviation (Sample)2.6%1.8%
Standard Deviation (Population)2.6%1.8%

Similar Demographics by Male Unemployment

Demographics Similar to Maltese by Male Unemployment

In terms of male unemployment, the demographic groups most similar to Maltese are Immigrants from Romania (5.1%, a difference of 0.020%), Immigrants from North Macedonia (5.1%, a difference of 0.040%), Serbian (5.1%, a difference of 0.090%), Immigrants from Sri Lanka (5.1%, a difference of 0.20%), and Immigrants from Eritrea (5.0%, a difference of 0.21%).
DemographicsRating | RankMale Unemployment
South Africans
96.4
/100
|
#79
Exceptional
5.0%
Argentineans
96.2
/100
|
#80
Exceptional
5.0%
French
96.2
/100
|
#81
Exceptional
5.0%
Chileans
96.2
/100
|
#82
Exceptional
5.0%
Immigrants | Eritrea
96.0
/100
|
#83
Exceptional
5.0%
Serbians
95.7
/100
|
#84
Exceptional
5.1%
Immigrants | North Macedonia
95.6
/100
|
#85
Exceptional
5.1%
Maltese
95.5
/100
|
#86
Exceptional
5.1%
Immigrants | Romania
95.4
/100
|
#87
Exceptional
5.1%
Immigrants | Sri Lanka
94.9
/100
|
#88
Exceptional
5.1%
Immigrants | Australia
94.7
/100
|
#89
Exceptional
5.1%
Okinawans
94.7
/100
|
#90
Exceptional
5.1%
Immigrants | Turkey
94.4
/100
|
#91
Exceptional
5.1%
Slavs
94.2
/100
|
#92
Exceptional
5.1%
Immigrants | Serbia
94.2
/100
|
#93
Exceptional
5.1%

Demographics Similar to Immigrants from Syria by Male Unemployment

In terms of male unemployment, the demographic groups most similar to Immigrants from Syria are Immigrants from Ukraine (5.5%, a difference of 0.10%), Immigrants from Lebanon (5.5%, a difference of 0.13%), Immigrants from Middle Africa (5.5%, a difference of 0.18%), South American Indian (5.5%, a difference of 0.31%), and Immigrants from Costa Rica (5.5%, a difference of 0.32%).
DemographicsRating | RankMale Unemployment
Immigrants | Zaire
13.7
/100
|
#200
Poor
5.4%
Immigrants | Philippines
13.5
/100
|
#201
Poor
5.4%
Immigrants | Nonimmigrants
13.1
/100
|
#202
Poor
5.4%
Immigrants | Laos
13.0
/100
|
#203
Poor
5.4%
Guamanians/Chamorros
12.3
/100
|
#204
Poor
5.4%
Immigrants | Costa Rica
11.4
/100
|
#205
Poor
5.5%
Immigrants | Ukraine
9.9
/100
|
#206
Tragic
5.5%
Immigrants | Syria
9.3
/100
|
#207
Tragic
5.5%
Immigrants | Lebanon
8.6
/100
|
#208
Tragic
5.5%
Immigrants | Middle Africa
8.3
/100
|
#209
Tragic
5.5%
South American Indians
7.6
/100
|
#210
Tragic
5.5%
Israelis
7.4
/100
|
#211
Tragic
5.5%
Hmong
7.0
/100
|
#212
Tragic
5.5%
Ugandans
6.3
/100
|
#213
Tragic
5.5%
Puget Sound Salish
5.6
/100
|
#214
Tragic
5.5%