Jordanian vs Immigrants from Syria Male Unemployment

COMPARE

Jordanian
Race
Ancestry
AfghanAfricanAlaska NativeAlaskan AthabascanAlbanianAleutAlsatianAmericanApacheArabArapahoArgentineanArmenianAssyrian/Chaldean/SyriacAustralianAustrianBahamianBangladeshiBarbadianBasqueBelgianBelizeanBermudanBhutaneseBlackfeetBolivianBrazilianBritishBritish West IndianBulgarianBurmeseCajunCambodianCanadianCape VerdeanCarpatho RusynCelticCentral AmericanCentral American IndianCherokeeCheyenneChickasawChileanChineseChippewaChoctawColombianColvilleComancheCosta RicanCreeCreekCroatianCrowCubanCypriotCzechCzechoslovakianDanishDelawareDominicanDutchDutch West IndianEastern EuropeanEcuadorianEgyptianEnglishEstonianEthiopianEuropeanFijianFilipinoFinnishFrenchFrench American IndianFrench CanadianGermanGerman RussianGhanaianGreekGuamanian/ChamorroGuatemalanGuyaneseHaitianHmongHonduranHopiHoumaHungarianIcelanderIndian (Asian)IndonesianInupiatIranianIraqiIrishIroquoisIsraeliItalianJamaicanJapaneseJordanianKenyanKiowaKoreanLaotianLatvianLebaneseLiberianLithuanianLumbeeLuxembourgerMacedonianMalaysianMalteseMarshalleseMenomineeMexicanMexican American IndianMongolianMoroccanNative HawaiianNavajoNepaleseNew ZealanderNicaraguanNigerianNorthern EuropeanNorwegianOkinawanOsageOttawaPaiutePakistaniPalestinianPanamanianParaguayanPennsylvania GermanPeruvianPimaPolishPortuguesePotawatomiPuebloPuerto RicanPuget Sound SalishRomanianRussianSalvadoranSamoanScandinavianScotch-IrishScottishSeminoleSenegaleseSerbianShoshoneSierra LeoneanSiouxSlavicSlovakSloveneSomaliSouth AfricanSouth AmericanSouth American IndianSoviet UnionSpaniardSpanishSpanish AmericanSpanish American IndianSri LankanSubsaharan AfricanSudaneseSwedishSwissSyrianTaiwaneseThaiTlingit-HaidaTohono O'OdhamTonganTrinidadian and TobagonianTsimshianTurkishU.S. Virgin IslanderUgandanUkrainianUruguayanUteVenezuelanVietnameseWelshWest IndianYakamaYaquiYugoslavianYumanYup'ikZimbabwean
Immigration
NonimmigrantsImmigrantsAfghanistanAfricaAlbaniaArgentinaArmeniaAsiaAustraliaAustriaBahamasBangladeshBarbadosBelarusBelgiumBelizeBoliviaBosnia and HerzegovinaBrazilBulgariaBurma/MyanmarCabo VerdeCambodiaCameroonCanadaCaribbeanCentral AmericaChileChinaColombiaCongoCosta RicaCroatiaCubaCzechoslovakiaDenmarkDominicaDominican RepublicEastern AfricaEastern AsiaEastern EuropeEcuadorEgyptEl SalvadorEnglandEritreaEthiopiaEuropeFijiFranceGermanyGhanaGreeceGrenadaGuatemalaGuyanaHaitiHondurasHong KongHungaryIndiaIndonesiaIranIraqIrelandIsraelItalyJamaicaJapanJordanKazakhstanKenyaKoreaKuwaitLaosLatin AmericaLatviaLebanonLiberiaLithuaniaMalaysiaMexicoMicronesiaMiddle AfricaMoldovaMoroccoNepalNetherlandsNicaraguaNigeriaNorth AmericaNorth MacedoniaNorthern AfricaNorthern EuropeNorwayOceaniaPakistanPanamaPeruPhilippinesPolandPortugalRomaniaRussiaSaudi ArabiaScotlandSenegalSerbiaSierra LeoneSingaporeSomaliaSouth AfricaSouth AmericaSouth Central AsiaSouth Eastern AsiaSouthern EuropeSpainSri LankaSt. Vincent and the GrenadinesSudanSwedenSwitzerlandTaiwanThailandTrinidad and TobagoTurkeyUgandaUkraineUruguayUzbekistanVenezuelaVietnamWest IndiesWestern AfricaWestern AsiaWestern EuropeYemenZaireZimbabweAzores
Immigrants from Syria
Race
Ancestry
AfghanAfricanAlaska NativeAlaskan AthabascanAlbanianAleutAlsatianAmericanApacheArabArapahoArgentineanArmenianAssyrian/Chaldean/SyriacAustralianAustrianBahamianBangladeshiBarbadianBasqueBelgianBelizeanBermudanBhutaneseBlackfeetBolivianBrazilianBritishBritish West IndianBulgarianBurmeseCajunCambodianCanadianCape VerdeanCarpatho RusynCelticCentral AmericanCentral American IndianCherokeeCheyenneChickasawChileanChineseChippewaChoctawColombianColvilleComancheCosta RicanCreeCreekCroatianCrowCubanCypriotCzechCzechoslovakianDanishDelawareDominicanDutchDutch West IndianEastern EuropeanEcuadorianEgyptianEnglishEstonianEthiopianEuropeanFijianFilipinoFinnishFrenchFrench American IndianFrench CanadianGermanGerman RussianGhanaianGreekGuamanian/ChamorroGuatemalanGuyaneseHaitianHmongHonduranHopiHoumaHungarianIcelanderIndian (Asian)IndonesianInupiatIranianIraqiIrishIroquoisIsraeliItalianJamaicanJapaneseKenyanKiowaKoreanLaotianLatvianLebaneseLiberianLithuanianLumbeeLuxembourgerMacedonianMalaysianMalteseMarshalleseMenomineeMexicanMexican American IndianMongolianMoroccanNative HawaiianNavajoNepaleseNew ZealanderNicaraguanNigerianNorthern EuropeanNorwegianOkinawanOsageOttawaPaiutePakistaniPalestinianPanamanianParaguayanPennsylvania GermanPeruvianPimaPolishPortuguesePotawatomiPuebloPuerto RicanPuget Sound SalishRomanianRussianSalvadoranSamoanScandinavianScotch-IrishScottishSeminoleSenegaleseSerbianShoshoneSierra LeoneanSiouxSlavicSlovakSloveneSomaliSouth AfricanSouth AmericanSouth American IndianSoviet UnionSpaniardSpanishSpanish AmericanSpanish American IndianSri LankanSubsaharan AfricanSudaneseSwedishSwissSyrianTaiwaneseThaiTlingit-HaidaTohono O'OdhamTonganTrinidadian and TobagonianTsimshianTurkishU.S. Virgin IslanderUgandanUkrainianUruguayanUteVenezuelanVietnameseWelshWest IndianYakamaYaquiYugoslavianYumanYup'ikZimbabwean
Immigration
NonimmigrantsImmigrantsAfghanistanAfricaAlbaniaArgentinaArmeniaAsiaAustraliaAustriaBahamasBangladeshBarbadosBelarusBelgiumBelizeBoliviaBosnia and HerzegovinaBrazilBulgariaBurma/MyanmarCabo VerdeCambodiaCameroonCanadaCaribbeanCentral AmericaChileChinaColombiaCongoCosta RicaCroatiaCubaCzechoslovakiaDenmarkDominicaDominican RepublicEastern AfricaEastern AsiaEastern EuropeEcuadorEgyptEl SalvadorEnglandEritreaEthiopiaEuropeFijiFranceGermanyGhanaGreeceGrenadaGuatemalaGuyanaHaitiHondurasHong KongHungaryIndiaIndonesiaIranIraqIrelandIsraelItalyJamaicaJapanJordanKazakhstanKenyaKoreaKuwaitLaosLatin AmericaLatviaLebanonLiberiaLithuaniaMalaysiaMexicoMicronesiaMiddle AfricaMoldovaMoroccoNepalNetherlandsNicaraguaNigeriaNorth AmericaNorth MacedoniaNorthern AfricaNorthern EuropeNorwayOceaniaPakistanPanamaPeruPhilippinesPolandPortugalRomaniaRussiaSaudi ArabiaScotlandSenegalSerbiaSierra LeoneSingaporeSomaliaSouth AfricaSouth AmericaSouth Central AsiaSouth Eastern AsiaSouthern EuropeSpainSri LankaSt. Vincent and the GrenadinesSudanSwedenSwitzerlandSyriaTaiwanThailandTrinidad and TobagoTurkeyUgandaUkraineUruguayUzbekistanVenezuelaVietnamWest IndiesWestern AfricaWestern AsiaWestern EuropeYemenZaireZimbabweAzores
Male Unemployment
Income
Poverty
Unemployment
Labor Participation
Family Structure
Vehicle Availability
Education Level
Disability

Male Unemployment Comparison

Jordanians

Immigrants from Syria

Exceptional
Tragic
5.0%
MALE UNEMPLOYMENT
98.8/ 100
METRIC RATING
53rd/ 347
METRIC RANK
5.5%
MALE UNEMPLOYMENT
9.3/ 100
METRIC RATING
207th/ 347
METRIC RANK

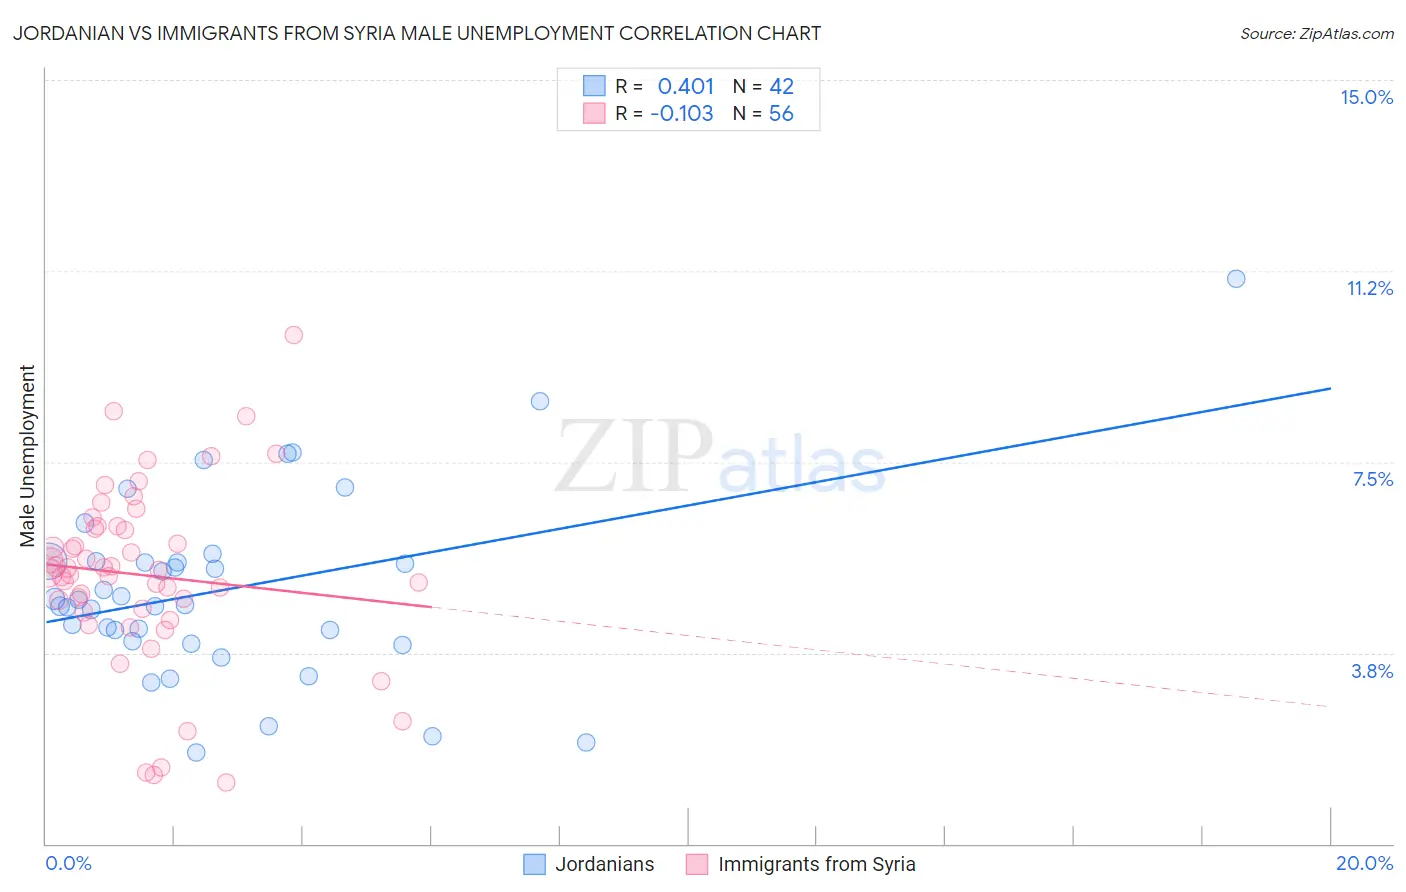
Jordanian vs Immigrants from Syria Male Unemployment Correlation Chart

The statistical analysis conducted on geographies consisting of 166,295,233 people shows a moderate positive correlation between the proportion of Jordanians and unemployment rate among males in the United States with a correlation coefficient (R) of 0.401 and weighted average of 5.0%. Similarly, the statistical analysis conducted on geographies consisting of 173,829,424 people shows a poor negative correlation between the proportion of Immigrants from Syria and unemployment rate among males in the United States with a correlation coefficient (R) of -0.103 and weighted average of 5.5%, a difference of 10.4%.
Jordanian vs Immigrants from Syria Male Unemployment

Male Unemployment Correlation Summary

MeasurementJordanianImmigrants from Syria
Minimum1.8%1.2%
Maximum11.1%10.0%
Range9.3%8.8%
Mean5.0%5.3%
Median4.7%5.4%
Interquartile 25% (IQ1)4.0%4.6%
Interquartile 75% (IQ3)5.5%6.2%
Interquartile Range (IQR)1.6%1.6%
Standard Deviation (Sample)1.8%1.8%
Standard Deviation (Population)1.8%1.8%

Similar Demographics by Male Unemployment

Demographics Similar to Jordanians by Male Unemployment

In terms of male unemployment, the demographic groups most similar to Jordanians are Irish (5.0%, a difference of 0.060%), Slovene (5.0%, a difference of 0.080%), Yugoslavian (5.0%, a difference of 0.10%), Croatian (4.9%, a difference of 0.11%), and Czechoslovakian (5.0%, a difference of 0.11%).
DemographicsRating | RankMale Unemployment
Bhutanese
98.9
/100
|
#46
Exceptional
4.9%
Austrians
98.9
/100
|
#47
Exceptional
4.9%
Immigrants | Scotland
98.9
/100
|
#48
Exceptional
4.9%
Poles
98.9
/100
|
#49
Exceptional
4.9%
Croatians
98.9
/100
|
#50
Exceptional
4.9%
Slovenes
98.8
/100
|
#51
Exceptional
5.0%
Irish
98.8
/100
|
#52
Exceptional
5.0%
Jordanians
98.8
/100
|
#53
Exceptional
5.0%
Yugoslavians
98.7
/100
|
#54
Exceptional
5.0%
Czechoslovakians
98.7
/100
|
#55
Exceptional
5.0%
Immigrants | Bulgaria
98.7
/100
|
#56
Exceptional
5.0%
Turks
98.5
/100
|
#57
Exceptional
5.0%
Lithuanians
98.5
/100
|
#58
Exceptional
5.0%
Immigrants | Netherlands
98.3
/100
|
#59
Exceptional
5.0%
Immigrants | Argentina
98.1
/100
|
#60
Exceptional
5.0%

Demographics Similar to Immigrants from Syria by Male Unemployment

In terms of male unemployment, the demographic groups most similar to Immigrants from Syria are Immigrants from Ukraine (5.5%, a difference of 0.10%), Immigrants from Lebanon (5.5%, a difference of 0.13%), Immigrants from Middle Africa (5.5%, a difference of 0.18%), South American Indian (5.5%, a difference of 0.31%), and Immigrants from Costa Rica (5.5%, a difference of 0.32%).
DemographicsRating | RankMale Unemployment
Immigrants | Zaire
13.7
/100
|
#200
Poor
5.4%
Immigrants | Philippines
13.5
/100
|
#201
Poor
5.4%
Immigrants | Nonimmigrants
13.1
/100
|
#202
Poor
5.4%
Immigrants | Laos
13.0
/100
|
#203
Poor
5.4%
Guamanians/Chamorros
12.3
/100
|
#204
Poor
5.4%
Immigrants | Costa Rica
11.4
/100
|
#205
Poor
5.5%
Immigrants | Ukraine
9.9
/100
|
#206
Tragic
5.5%
Immigrants | Syria
9.3
/100
|
#207
Tragic
5.5%
Immigrants | Lebanon
8.6
/100
|
#208
Tragic
5.5%
Immigrants | Middle Africa
8.3
/100
|
#209
Tragic
5.5%
South American Indians
7.6
/100
|
#210
Tragic
5.5%
Israelis
7.4
/100
|
#211
Tragic
5.5%
Hmong
7.0
/100
|
#212
Tragic
5.5%
Ugandans
6.3
/100
|
#213
Tragic
5.5%
Puget Sound Salish
5.6
/100
|
#214
Tragic
5.5%