Maltese vs Guyanese Unemployment Among Seniors over 65 years

COMPARE

Maltese
Race
Ancestry
AfghanAfricanAlaska NativeAlaskan AthabascanAlbanianAleutAlsatianAmericanApacheArabArapahoArgentineanArmenianAssyrian/Chaldean/SyriacAustralianAustrianBahamianBangladeshiBarbadianBasqueBelgianBelizeanBermudanBhutaneseBlackfeetBolivianBrazilianBritishBritish West IndianBulgarianBurmeseCajunCambodianCanadianCape VerdeanCarpatho RusynCelticCentral AmericanCentral American IndianCherokeeCheyenneChickasawChileanChineseChippewaChoctawColombianColvilleComancheCosta RicanCreeCreekCroatianCrowCubanCypriotCzechCzechoslovakianDanishDelawareDominicanDutchDutch West IndianEastern EuropeanEcuadorianEgyptianEnglishEstonianEthiopianEuropeanFijianFilipinoFinnishFrenchFrench American IndianFrench CanadianGermanGerman RussianGhanaianGreekGuamanian/ChamorroGuatemalanHaitianHmongHonduranHopiHoumaHungarianIcelanderIndian (Asian)IndonesianInupiatIranianIraqiIrishIroquoisIsraeliItalianJamaicanJapaneseJordanianKenyanKiowaKoreanLaotianLatvianLebaneseLiberianLithuanianLumbeeLuxembourgerMacedonianMalaysianMalteseMarshalleseMenomineeMexicanMexican American IndianMongolianMoroccanNative HawaiianNavajoNepaleseNew ZealanderNicaraguanNigerianNorthern EuropeanNorwegianOkinawanOsageOttawaPaiutePakistaniPalestinianPanamanianParaguayanPennsylvania GermanPeruvianPimaPolishPortuguesePotawatomiPuebloPuerto RicanPuget Sound SalishRomanianRussianSalvadoranSamoanScandinavianScotch-IrishScottishSeminoleSenegaleseSerbianShoshoneSierra LeoneanSiouxSlavicSlovakSloveneSomaliSouth AfricanSouth AmericanSouth American IndianSoviet UnionSpaniardSpanishSpanish AmericanSpanish American IndianSri LankanSubsaharan AfricanSudaneseSwedishSwissSyrianTaiwaneseThaiTlingit-HaidaTohono O'OdhamTonganTrinidadian and TobagonianTsimshianTurkishU.S. Virgin IslanderUgandanUkrainianUruguayanUteVenezuelanVietnameseWelshWest IndianYakamaYaquiYugoslavianYumanYup'ikZimbabwean
Immigration
NonimmigrantsImmigrantsAfghanistanAfricaAlbaniaArgentinaArmeniaAsiaAustraliaAustriaBahamasBangladeshBarbadosBelarusBelgiumBelizeBoliviaBosnia and HerzegovinaBrazilBulgariaBurma/MyanmarCabo VerdeCambodiaCameroonCanadaCaribbeanCentral AmericaChileChinaColombiaCongoCosta RicaCroatiaCubaCzechoslovakiaDenmarkDominicaDominican RepublicEastern AfricaEastern AsiaEastern EuropeEcuadorEgyptEl SalvadorEnglandEritreaEthiopiaEuropeFijiFranceGermanyGhanaGreeceGrenadaGuatemalaGuyanaHaitiHondurasHong KongHungaryIndiaIndonesiaIranIraqIrelandIsraelItalyJamaicaJapanJordanKazakhstanKenyaKoreaKuwaitLaosLatin AmericaLatviaLebanonLiberiaLithuaniaMalaysiaMexicoMicronesiaMiddle AfricaMoldovaMoroccoNepalNetherlandsNicaraguaNigeriaNorth AmericaNorth MacedoniaNorthern AfricaNorthern EuropeNorwayOceaniaPakistanPanamaPeruPhilippinesPolandPortugalRomaniaRussiaSaudi ArabiaScotlandSenegalSerbiaSierra LeoneSingaporeSomaliaSouth AfricaSouth AmericaSouth Central AsiaSouth Eastern AsiaSouthern EuropeSpainSri LankaSt. Vincent and the GrenadinesSudanSwedenSwitzerlandSyriaTaiwanThailandTrinidad and TobagoTurkeyUgandaUkraineUruguayUzbekistanVenezuelaVietnamWest IndiesWestern AfricaWestern AsiaWestern EuropeYemenZaireZimbabweAzores
Guyanese
Race
Ancestry
AfghanAfricanAlaska NativeAlaskan AthabascanAlbanianAleutAlsatianAmericanApacheArabArapahoArgentineanArmenianAssyrian/Chaldean/SyriacAustralianAustrianBahamianBangladeshiBarbadianBasqueBelgianBelizeanBermudanBhutaneseBlackfeetBolivianBrazilianBritishBritish West IndianBulgarianBurmeseCajunCambodianCanadianCape VerdeanCarpatho RusynCelticCentral AmericanCentral American IndianCherokeeCheyenneChickasawChileanChineseChippewaChoctawColombianColvilleComancheCosta RicanCreeCreekCroatianCrowCubanCypriotCzechCzechoslovakianDanishDelawareDominicanDutchDutch West IndianEastern EuropeanEcuadorianEgyptianEnglishEstonianEthiopianEuropeanFijianFilipinoFinnishFrenchFrench American IndianFrench CanadianGermanGerman RussianGhanaianGreekGuamanian/ChamorroGuatemalanGuyaneseHaitianHmongHonduranHopiHoumaHungarianIcelanderIndian (Asian)IndonesianInupiatIranianIraqiIrishIroquoisIsraeliItalianJamaicanJapaneseJordanianKenyanKiowaKoreanLaotianLatvianLebaneseLiberianLithuanianLumbeeLuxembourgerMacedonianMalaysianMarshalleseMenomineeMexicanMexican American IndianMongolianMoroccanNative HawaiianNavajoNepaleseNew ZealanderNicaraguanNigerianNorthern EuropeanNorwegianOkinawanOsageOttawaPaiutePakistaniPalestinianPanamanianParaguayanPennsylvania GermanPeruvianPimaPolishPortuguesePotawatomiPuebloPuerto RicanPuget Sound SalishRomanianRussianSalvadoranSamoanScandinavianScotch-IrishScottishSeminoleSenegaleseSerbianShoshoneSierra LeoneanSiouxSlavicSlovakSloveneSomaliSouth AfricanSouth AmericanSouth American IndianSoviet UnionSpaniardSpanishSpanish AmericanSpanish American IndianSri LankanSubsaharan AfricanSudaneseSwedishSwissSyrianTaiwaneseThaiTlingit-HaidaTohono O'OdhamTonganTrinidadian and TobagonianTsimshianTurkishU.S. Virgin IslanderUgandanUkrainianUruguayanUteVenezuelanVietnameseWelshWest IndianYakamaYaquiYugoslavianYumanYup'ikZimbabwean
Immigration
NonimmigrantsImmigrantsAfghanistanAfricaAlbaniaArgentinaArmeniaAsiaAustraliaAustriaBahamasBangladeshBarbadosBelarusBelgiumBelizeBoliviaBosnia and HerzegovinaBrazilBulgariaBurma/MyanmarCabo VerdeCambodiaCameroonCanadaCaribbeanCentral AmericaChileChinaColombiaCongoCosta RicaCroatiaCubaCzechoslovakiaDenmarkDominicaDominican RepublicEastern AfricaEastern AsiaEastern EuropeEcuadorEgyptEl SalvadorEnglandEritreaEthiopiaEuropeFijiFranceGermanyGhanaGreeceGrenadaGuatemalaGuyanaHaitiHondurasHong KongHungaryIndiaIndonesiaIranIraqIrelandIsraelItalyJamaicaJapanJordanKazakhstanKenyaKoreaKuwaitLaosLatin AmericaLatviaLebanonLiberiaLithuaniaMalaysiaMexicoMicronesiaMiddle AfricaMoldovaMoroccoNepalNetherlandsNicaraguaNigeriaNorth AmericaNorth MacedoniaNorthern AfricaNorthern EuropeNorwayOceaniaPakistanPanamaPeruPhilippinesPolandPortugalRomaniaRussiaSaudi ArabiaScotlandSenegalSerbiaSierra LeoneSingaporeSomaliaSouth AfricaSouth AmericaSouth Central AsiaSouth Eastern AsiaSouthern EuropeSpainSri LankaSt. Vincent and the GrenadinesSudanSwedenSwitzerlandSyriaTaiwanThailandTrinidad and TobagoTurkeyUgandaUkraineUruguayUzbekistanVenezuelaVietnamWest IndiesWestern AfricaWestern AsiaWestern EuropeYemenZaireZimbabweAzores
Unemployment Among Seniors over 65 years
Income
Poverty
Unemployment
Labor Participation
Family Structure
Vehicle Availability
Education Level
Disability

Unemployment Among Seniors over 65 years Comparison

Maltese

Guyanese

Poor
Tragic
5.2%
UNEMPLOYMENT AMONG SENIORS OVER 65 YEARS
19.6/ 100
METRIC RATING
198th/ 347
METRIC RANK
5.6%
UNEMPLOYMENT AMONG SENIORS OVER 65 YEARS
0.0/ 100
METRIC RATING
299th/ 347
METRIC RANK

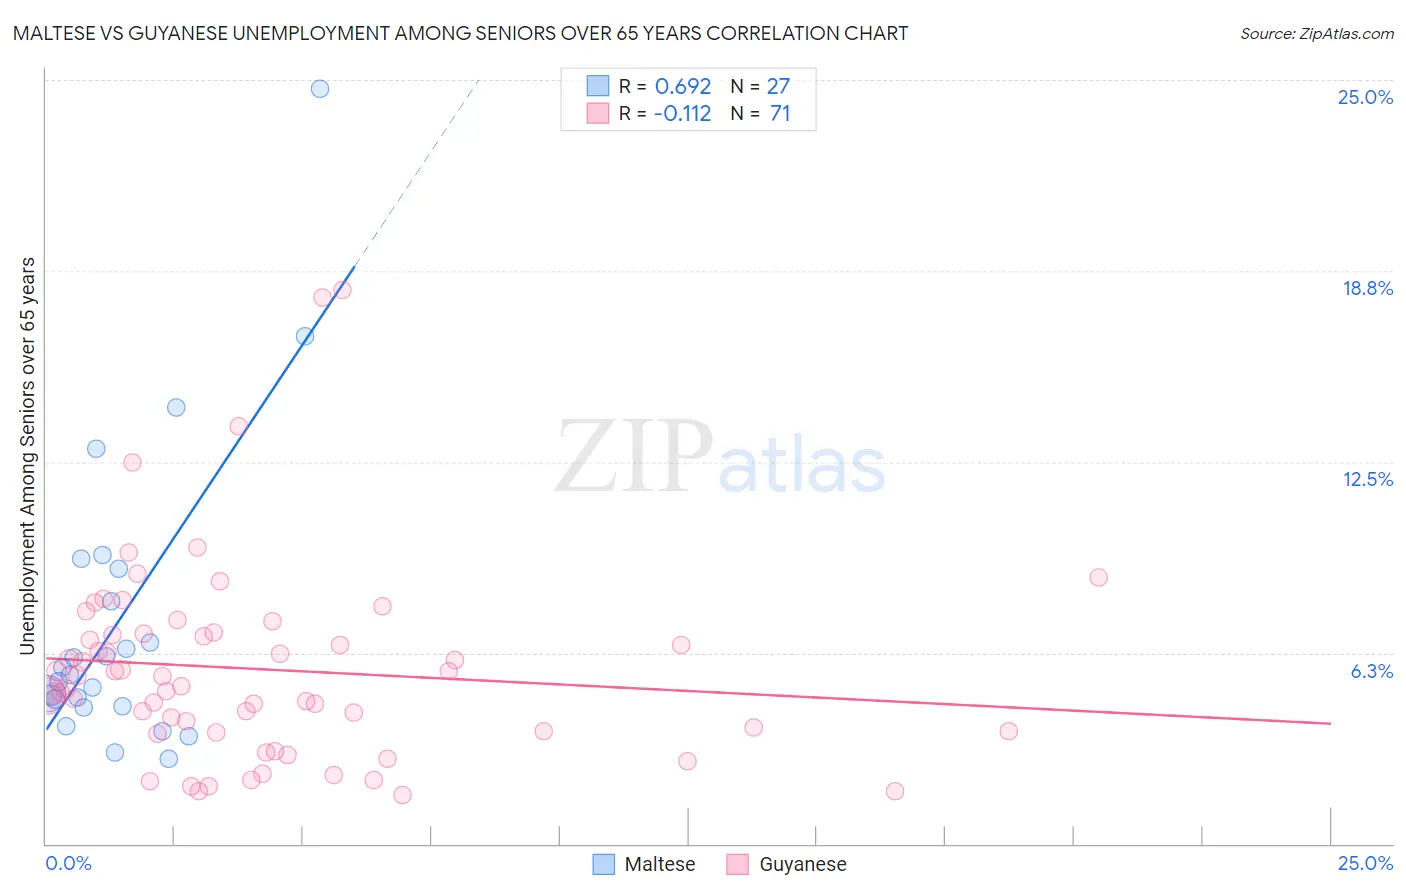
Maltese vs Guyanese Unemployment Among Seniors over 65 years Correlation Chart

The statistical analysis conducted on geographies consisting of 121,690,433 people shows a significant positive correlation between the proportion of Maltese and unemployment rate amomg seniors over the age of 65 in the United States with a correlation coefficient (R) of 0.692 and weighted average of 5.2%. Similarly, the statistical analysis conducted on geographies consisting of 168,241,016 people shows a poor negative correlation between the proportion of Guyanese and unemployment rate amomg seniors over the age of 65 in the United States with a correlation coefficient (R) of -0.112 and weighted average of 5.6%, a difference of 6.8%.
Maltese vs Guyanese Unemployment Among Seniors over 65 years

Unemployment Among Seniors over 65 years Correlation Summary

MeasurementMalteseGuyanese
Minimum2.8%1.6%
Maximum24.7%18.1%
Range21.9%16.5%
Mean7.3%5.7%
Median5.5%5.1%
Interquartile 25% (IQ1)4.5%3.7%
Interquartile 75% (IQ3)9.0%6.9%
Interquartile Range (IQR)4.5%3.2%
Standard Deviation (Sample)4.9%3.2%
Standard Deviation (Population)4.8%3.2%

Similar Demographics by Unemployment Among Seniors over 65 years

Demographics Similar to Maltese by Unemployment Among Seniors over 65 years

In terms of unemployment among seniors over 65 years, the demographic groups most similar to Maltese are Immigrants from Europe (5.2%, a difference of 0.030%), Immigrants from Pakistan (5.2%, a difference of 0.060%), Laotian (5.2%, a difference of 0.080%), Immigrants from Northern Africa (5.2%, a difference of 0.10%), and Subsaharan African (5.2%, a difference of 0.13%).
DemographicsRating | RankUnemployment Among Seniors over 65 years
Immigrants | Denmark
31.0
/100
|
#191
Fair
5.2%
Sioux
30.8
/100
|
#192
Fair
5.2%
Immigrants | Africa
29.6
/100
|
#193
Fair
5.2%
Argentineans
29.1
/100
|
#194
Fair
5.2%
Costa Ricans
27.0
/100
|
#195
Fair
5.2%
Immigrants | Poland
24.3
/100
|
#196
Fair
5.2%
Guamanians/Chamorros
22.5
/100
|
#197
Fair
5.2%
Maltese
19.6
/100
|
#198
Poor
5.2%
Immigrants | Europe
19.0
/100
|
#199
Poor
5.2%
Immigrants | Pakistan
18.4
/100
|
#200
Poor
5.2%
Laotians
18.1
/100
|
#201
Poor
5.2%
Immigrants | Northern Africa
17.7
/100
|
#202
Poor
5.2%
Sub-Saharan Africans
17.1
/100
|
#203
Poor
5.2%
Immigrants | China
16.9
/100
|
#204
Poor
5.2%
South American Indians
15.3
/100
|
#205
Poor
5.2%

Demographics Similar to Guyanese by Unemployment Among Seniors over 65 years

In terms of unemployment among seniors over 65 years, the demographic groups most similar to Guyanese are Zimbabwean (5.6%, a difference of 0.050%), Immigrants from West Indies (5.6%, a difference of 0.090%), Yaqui (5.5%, a difference of 0.21%), Cheyenne (5.5%, a difference of 0.22%), and Cape Verdean (5.5%, a difference of 0.22%).
DemographicsRating | RankUnemployment Among Seniors over 65 years
Belizeans
0.0
/100
|
#292
Tragic
5.5%
Immigrants | Venezuela
0.0
/100
|
#293
Tragic
5.5%
Armenians
0.0
/100
|
#294
Tragic
5.5%
Cheyenne
0.0
/100
|
#295
Tragic
5.5%
Cape Verdeans
0.0
/100
|
#296
Tragic
5.5%
Yaqui
0.0
/100
|
#297
Tragic
5.5%
Immigrants | West Indies
0.0
/100
|
#298
Tragic
5.6%
Guyanese
0.0
/100
|
#299
Tragic
5.6%
Zimbabweans
0.0
/100
|
#300
Tragic
5.6%
Hispanics or Latinos
0.0
/100
|
#301
Tragic
5.6%
Guatemalans
0.0
/100
|
#302
Tragic
5.6%
Immigrants | Latin America
0.0
/100
|
#303
Tragic
5.6%
Liberians
0.0
/100
|
#304
Tragic
5.6%
Mexicans
0.0
/100
|
#305
Tragic
5.6%
Ecuadorians
0.0
/100
|
#306
Tragic
5.6%