Maltese vs Asian Unemployment Among Seniors over 65 years

COMPARE

Maltese
Race
Ancestry
AfghanAfricanAlaska NativeAlaskan AthabascanAlbanianAleutAlsatianAmericanApacheArabArapahoArgentineanArmenianAssyrian/Chaldean/SyriacAustralianAustrianBahamianBangladeshiBarbadianBasqueBelgianBelizeanBermudanBhutaneseBlackfeetBolivianBrazilianBritishBritish West IndianBulgarianBurmeseCajunCambodianCanadianCape VerdeanCarpatho RusynCelticCentral AmericanCentral American IndianCherokeeCheyenneChickasawChileanChineseChippewaChoctawColombianColvilleComancheCosta RicanCreeCreekCroatianCrowCubanCypriotCzechCzechoslovakianDanishDelawareDominicanDutchDutch West IndianEastern EuropeanEcuadorianEgyptianEnglishEstonianEthiopianEuropeanFijianFilipinoFinnishFrenchFrench American IndianFrench CanadianGermanGerman RussianGhanaianGreekGuamanian/ChamorroGuatemalanGuyaneseHaitianHmongHonduranHopiHoumaHungarianIcelanderIndian (Asian)IndonesianInupiatIranianIraqiIrishIroquoisIsraeliItalianJamaicanJapaneseJordanianKenyanKiowaKoreanLaotianLatvianLebaneseLiberianLithuanianLumbeeLuxembourgerMacedonianMalaysianMalteseMarshalleseMenomineeMexicanMexican American IndianMongolianMoroccanNative HawaiianNavajoNepaleseNew ZealanderNicaraguanNigerianNorthern EuropeanNorwegianOkinawanOsageOttawaPaiutePakistaniPalestinianPanamanianParaguayanPennsylvania GermanPeruvianPimaPolishPortuguesePotawatomiPuebloPuerto RicanPuget Sound SalishRomanianRussianSalvadoranSamoanScandinavianScotch-IrishScottishSeminoleSenegaleseSerbianShoshoneSierra LeoneanSiouxSlavicSlovakSloveneSomaliSouth AfricanSouth AmericanSouth American IndianSoviet UnionSpaniardSpanishSpanish AmericanSpanish American IndianSri LankanSubsaharan AfricanSudaneseSwedishSwissSyrianTaiwaneseThaiTlingit-HaidaTohono O'OdhamTonganTrinidadian and TobagonianTsimshianTurkishU.S. Virgin IslanderUgandanUkrainianUruguayanUteVenezuelanVietnameseWelshWest IndianYakamaYaquiYugoslavianYumanYup'ikZimbabwean
Immigration
NonimmigrantsImmigrantsAfghanistanAfricaAlbaniaArgentinaArmeniaAsiaAustraliaAustriaBahamasBangladeshBarbadosBelarusBelgiumBelizeBoliviaBosnia and HerzegovinaBrazilBulgariaBurma/MyanmarCabo VerdeCambodiaCameroonCanadaCaribbeanCentral AmericaChileChinaColombiaCongoCosta RicaCroatiaCubaCzechoslovakiaDenmarkDominicaDominican RepublicEastern AfricaEastern AsiaEastern EuropeEcuadorEgyptEl SalvadorEnglandEritreaEthiopiaEuropeFijiFranceGermanyGhanaGreeceGrenadaGuatemalaGuyanaHaitiHondurasHong KongHungaryIndiaIndonesiaIranIraqIrelandIsraelItalyJamaicaJapanJordanKazakhstanKenyaKoreaKuwaitLaosLatin AmericaLatviaLebanonLiberiaLithuaniaMalaysiaMexicoMicronesiaMiddle AfricaMoldovaMoroccoNepalNetherlandsNicaraguaNigeriaNorth AmericaNorth MacedoniaNorthern AfricaNorthern EuropeNorwayOceaniaPakistanPanamaPeruPhilippinesPolandPortugalRomaniaRussiaSaudi ArabiaScotlandSenegalSerbiaSierra LeoneSingaporeSomaliaSouth AfricaSouth AmericaSouth Central AsiaSouth Eastern AsiaSouthern EuropeSpainSri LankaSt. Vincent and the GrenadinesSudanSwedenSwitzerlandSyriaTaiwanThailandTrinidad and TobagoTurkeyUgandaUkraineUruguayUzbekistanVenezuelaVietnamWest IndiesWestern AfricaWestern AsiaWestern EuropeYemenZaireZimbabweAzores
Asian
Race
Ancestry
AfghanAfricanAlaska NativeAlaskan AthabascanAlbanianAleutAlsatianAmericanApacheArabArapahoArgentineanArmenianAssyrian/Chaldean/SyriacAustralianAustrianBahamianBangladeshiBarbadianBasqueBelgianBelizeanBermudanBhutaneseBlackfeetBolivianBrazilianBritishBritish West IndianBulgarianBurmeseCajunCambodianCanadianCape VerdeanCarpatho RusynCelticCentral AmericanCentral American IndianCherokeeCheyenneChickasawChileanChineseChippewaChoctawColombianColvilleComancheCosta RicanCreeCreekCroatianCrowCubanCypriotCzechCzechoslovakianDanishDelawareDominicanDutchDutch West IndianEastern EuropeanEcuadorianEgyptianEnglishEstonianEthiopianEuropeanFijianFilipinoFinnishFrenchFrench American IndianFrench CanadianGermanGerman RussianGhanaianGreekGuamanian/ChamorroGuatemalanGuyaneseHaitianHmongHonduranHopiHoumaHungarianIcelanderIndian (Asian)IndonesianInupiatIranianIraqiIrishIroquoisIsraeliItalianJamaicanJapaneseJordanianKenyanKiowaKoreanLaotianLatvianLebaneseLiberianLithuanianLumbeeLuxembourgerMacedonianMalaysianMarshalleseMenomineeMexicanMexican American IndianMongolianMoroccanNative HawaiianNavajoNepaleseNew ZealanderNicaraguanNigerianNorthern EuropeanNorwegianOkinawanOsageOttawaPaiutePakistaniPalestinianPanamanianParaguayanPennsylvania GermanPeruvianPimaPolishPortuguesePotawatomiPuebloPuerto RicanPuget Sound SalishRomanianRussianSalvadoranSamoanScandinavianScotch-IrishScottishSeminoleSenegaleseSerbianShoshoneSierra LeoneanSiouxSlavicSlovakSloveneSomaliSouth AfricanSouth AmericanSouth American IndianSoviet UnionSpaniardSpanishSpanish AmericanSpanish American IndianSri LankanSubsaharan AfricanSudaneseSwedishSwissSyrianTaiwaneseThaiTlingit-HaidaTohono O'OdhamTonganTrinidadian and TobagonianTsimshianTurkishU.S. Virgin IslanderUgandanUkrainianUruguayanUteVenezuelanVietnameseWelshWest IndianYakamaYaquiYugoslavianYumanYup'ikZimbabwean
Immigration
NonimmigrantsImmigrantsAfghanistanAfricaAlbaniaArgentinaArmeniaAsiaAustraliaAustriaBahamasBangladeshBarbadosBelarusBelgiumBelizeBoliviaBosnia and HerzegovinaBrazilBulgariaBurma/MyanmarCabo VerdeCambodiaCameroonCanadaCaribbeanCentral AmericaChileChinaColombiaCongoCosta RicaCroatiaCubaCzechoslovakiaDenmarkDominicaDominican RepublicEastern AfricaEastern AsiaEastern EuropeEcuadorEgyptEl SalvadorEnglandEritreaEthiopiaEuropeFijiFranceGermanyGhanaGreeceGrenadaGuatemalaGuyanaHaitiHondurasHong KongHungaryIndiaIndonesiaIranIraqIrelandIsraelItalyJamaicaJapanJordanKazakhstanKenyaKoreaKuwaitLaosLatin AmericaLatviaLebanonLiberiaLithuaniaMalaysiaMexicoMicronesiaMiddle AfricaMoldovaMoroccoNepalNetherlandsNicaraguaNigeriaNorth AmericaNorth MacedoniaNorthern AfricaNorthern EuropeNorwayOceaniaPakistanPanamaPeruPhilippinesPolandPortugalRomaniaRussiaSaudi ArabiaScotlandSenegalSerbiaSierra LeoneSingaporeSomaliaSouth AfricaSouth AmericaSouth Central AsiaSouth Eastern AsiaSouthern EuropeSpainSri LankaSt. Vincent and the GrenadinesSudanSwedenSwitzerlandSyriaTaiwanThailandTrinidad and TobagoTurkeyUgandaUkraineUruguayUzbekistanVenezuelaVietnamWest IndiesWestern AfricaWestern AsiaWestern EuropeYemenZaireZimbabweAzores
Unemployment Among Seniors over 65 years
Income
Poverty
Unemployment
Labor Participation
Family Structure
Vehicle Availability
Education Level
Disability

Unemployment Among Seniors over 65 years Comparison

Maltese

Asians

Poor
Excellent
5.2%
UNEMPLOYMENT AMONG SENIORS OVER 65 YEARS
19.6/ 100
METRIC RATING
198th/ 347
METRIC RANK
5.1%
UNEMPLOYMENT AMONG SENIORS OVER 65 YEARS
88.5/ 100
METRIC RATING
123rd/ 347
METRIC RANK

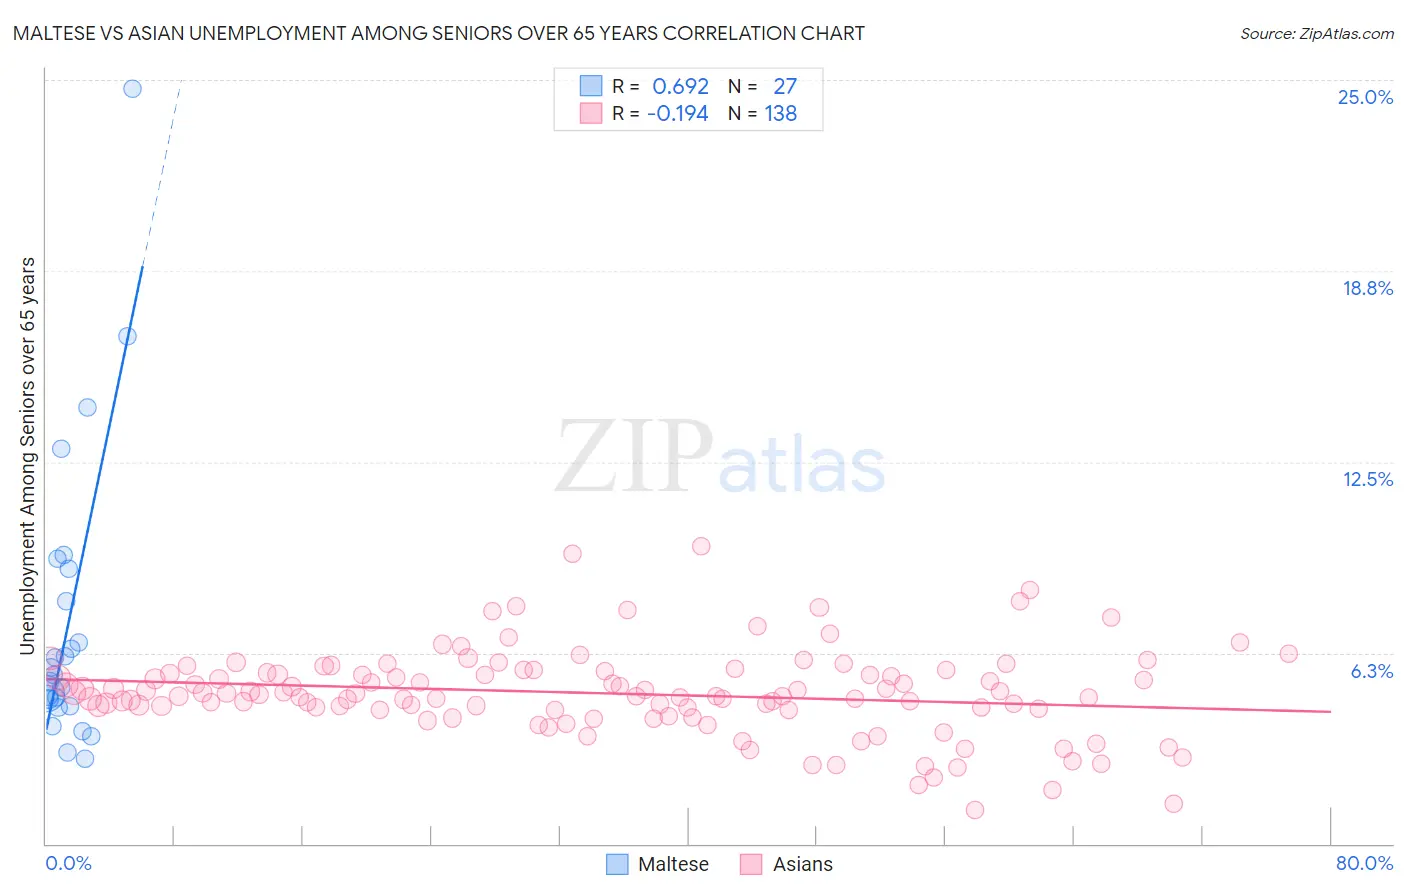
Maltese vs Asian Unemployment Among Seniors over 65 years Correlation Chart

The statistical analysis conducted on geographies consisting of 121,690,433 people shows a significant positive correlation between the proportion of Maltese and unemployment rate amomg seniors over the age of 65 in the United States with a correlation coefficient (R) of 0.692 and weighted average of 5.2%. Similarly, the statistical analysis conducted on geographies consisting of 456,767,809 people shows a poor negative correlation between the proportion of Asians and unemployment rate amomg seniors over the age of 65 in the United States with a correlation coefficient (R) of -0.194 and weighted average of 5.1%, a difference of 2.8%.
Maltese vs Asian Unemployment Among Seniors over 65 years

Unemployment Among Seniors over 65 years Correlation Summary

MeasurementMalteseAsian
Minimum2.8%1.1%
Maximum24.7%9.7%
Range21.9%8.6%
Mean7.3%4.9%
Median5.5%4.9%
Interquartile 25% (IQ1)4.5%4.4%
Interquartile 75% (IQ3)9.0%5.6%
Interquartile Range (IQR)4.5%1.2%
Standard Deviation (Sample)4.9%1.4%
Standard Deviation (Population)4.8%1.4%

Similar Demographics by Unemployment Among Seniors over 65 years

Demographics Similar to Maltese by Unemployment Among Seniors over 65 years

In terms of unemployment among seniors over 65 years, the demographic groups most similar to Maltese are Immigrants from Europe (5.2%, a difference of 0.030%), Immigrants from Pakistan (5.2%, a difference of 0.060%), Laotian (5.2%, a difference of 0.080%), Immigrants from Northern Africa (5.2%, a difference of 0.10%), and Subsaharan African (5.2%, a difference of 0.13%).
DemographicsRating | RankUnemployment Among Seniors over 65 years
Immigrants | Denmark
31.0
/100
|
#191
Fair
5.2%
Sioux
30.8
/100
|
#192
Fair
5.2%
Immigrants | Africa
29.6
/100
|
#193
Fair
5.2%
Argentineans
29.1
/100
|
#194
Fair
5.2%
Costa Ricans
27.0
/100
|
#195
Fair
5.2%
Immigrants | Poland
24.3
/100
|
#196
Fair
5.2%
Guamanians/Chamorros
22.5
/100
|
#197
Fair
5.2%
Maltese
19.6
/100
|
#198
Poor
5.2%
Immigrants | Europe
19.0
/100
|
#199
Poor
5.2%
Immigrants | Pakistan
18.4
/100
|
#200
Poor
5.2%
Laotians
18.1
/100
|
#201
Poor
5.2%
Immigrants | Northern Africa
17.7
/100
|
#202
Poor
5.2%
Sub-Saharan Africans
17.1
/100
|
#203
Poor
5.2%
Immigrants | China
16.9
/100
|
#204
Poor
5.2%
South American Indians
15.3
/100
|
#205
Poor
5.2%

Demographics Similar to Asians by Unemployment Among Seniors over 65 years

In terms of unemployment among seniors over 65 years, the demographic groups most similar to Asians are Immigrants from Cameroon (5.1%, a difference of 0.0%), Puget Sound Salish (5.1%, a difference of 0.010%), Irish (5.1%, a difference of 0.020%), Immigrants from North America (5.1%, a difference of 0.050%), and Dutch (5.1%, a difference of 0.070%).
DemographicsRating | RankUnemployment Among Seniors over 65 years
Immigrants | Korea
91.0
/100
|
#116
Exceptional
5.0%
Malaysians
90.4
/100
|
#117
Exceptional
5.1%
Soviet Union
90.1
/100
|
#118
Exceptional
5.1%
Immigrants | Canada
89.7
/100
|
#119
Excellent
5.1%
Irish
88.8
/100
|
#120
Excellent
5.1%
Puget Sound Salish
88.7
/100
|
#121
Excellent
5.1%
Immigrants | Cameroon
88.6
/100
|
#122
Excellent
5.1%
Asians
88.5
/100
|
#123
Excellent
5.1%
Immigrants | North America
87.9
/100
|
#124
Excellent
5.1%
Dutch
87.6
/100
|
#125
Excellent
5.1%
Immigrants | Sri Lanka
87.4
/100
|
#126
Excellent
5.1%
Sri Lankans
87.4
/100
|
#127
Excellent
5.1%
Australians
87.1
/100
|
#128
Excellent
5.1%
Immigrants | England
86.7
/100
|
#129
Excellent
5.1%
Iranians
86.6
/100
|
#130
Excellent
5.1%