Lithuanian vs Hopi Unemployment Among Women with Children Under 6 years

COMPARE

Lithuanian
Race
Ancestry
AfghanAfricanAlaska NativeAlaskan AthabascanAlbanianAleutAlsatianAmericanApacheArabArapahoArgentineanArmenianAssyrian/Chaldean/SyriacAustralianAustrianBahamianBangladeshiBarbadianBasqueBelgianBelizeanBermudanBhutaneseBlackfeetBolivianBrazilianBritishBritish West IndianBulgarianBurmeseCajunCambodianCanadianCape VerdeanCarpatho RusynCelticCentral AmericanCentral American IndianCherokeeCheyenneChickasawChileanChineseChippewaChoctawColombianColvilleComancheCosta RicanCreeCreekCroatianCrowCubanCypriotCzechCzechoslovakianDanishDelawareDominicanDutchDutch West IndianEastern EuropeanEcuadorianEgyptianEnglishEstonianEthiopianEuropeanFijianFilipinoFinnishFrenchFrench American IndianFrench CanadianGermanGerman RussianGhanaianGreekGuamanian/ChamorroGuatemalanGuyaneseHaitianHmongHonduranHoumaHungarianIcelanderIndian (Asian)IndonesianInupiatIranianIraqiIrishIroquoisIsraeliItalianJamaicanJapaneseJordanianKenyanKiowaKoreanLaotianLatvianLebaneseLiberianLithuanianLumbeeLuxembourgerMacedonianMalaysianMalteseMarshalleseMenomineeMexicanMexican American IndianMongolianMoroccanNative HawaiianNavajoNepaleseNew ZealanderNicaraguanNigerianNorthern EuropeanNorwegianOkinawanOsageOttawaPaiutePakistaniPalestinianPanamanianParaguayanPennsylvania GermanPeruvianPimaPolishPortuguesePotawatomiPuebloPuerto RicanPuget Sound SalishRomanianRussianSalvadoranSamoanScandinavianScotch-IrishScottishSeminoleSenegaleseSerbianShoshoneSierra LeoneanSiouxSlavicSlovakSloveneSomaliSouth AfricanSouth AmericanSouth American IndianSoviet UnionSpaniardSpanishSpanish AmericanSpanish American IndianSri LankanSubsaharan AfricanSudaneseSwedishSwissSyrianTaiwaneseThaiTlingit-HaidaTohono O'OdhamTonganTrinidadian and TobagonianTsimshianTurkishU.S. Virgin IslanderUgandanUkrainianUruguayanUteVenezuelanVietnameseWelshWest IndianYakamaYaquiYugoslavianYumanYup'ikZimbabwean
Immigration
NonimmigrantsImmigrantsAfghanistanAfricaAlbaniaArgentinaArmeniaAsiaAustraliaAustriaBahamasBangladeshBarbadosBelarusBelgiumBelizeBoliviaBosnia and HerzegovinaBrazilBulgariaBurma/MyanmarCabo VerdeCambodiaCameroonCanadaCaribbeanCentral AmericaChileChinaColombiaCongoCosta RicaCroatiaCubaCzechoslovakiaDenmarkDominicaDominican RepublicEastern AfricaEastern AsiaEastern EuropeEcuadorEgyptEl SalvadorEnglandEritreaEthiopiaEuropeFijiFranceGermanyGhanaGreeceGrenadaGuatemalaGuyanaHaitiHondurasHong KongHungaryIndiaIndonesiaIranIraqIrelandIsraelItalyJamaicaJapanJordanKazakhstanKenyaKoreaKuwaitLaosLatin AmericaLatviaLebanonLiberiaLithuaniaMalaysiaMexicoMicronesiaMiddle AfricaMoldovaMoroccoNepalNetherlandsNicaraguaNigeriaNorth AmericaNorth MacedoniaNorthern AfricaNorthern EuropeNorwayOceaniaPakistanPanamaPeruPhilippinesPolandPortugalRomaniaRussiaSaudi ArabiaScotlandSenegalSerbiaSierra LeoneSingaporeSomaliaSouth AfricaSouth AmericaSouth Central AsiaSouth Eastern AsiaSouthern EuropeSpainSri LankaSt. Vincent and the GrenadinesSudanSwedenSwitzerlandSyriaTaiwanThailandTrinidad and TobagoTurkeyUgandaUkraineUruguayUzbekistanVenezuelaVietnamWest IndiesWestern AfricaWestern AsiaWestern EuropeYemenZaireZimbabweAzores
Hopi
Race
Ancestry
AfghanAfricanAlaska NativeAlaskan AthabascanAlbanianAleutAlsatianAmericanApacheArabArapahoArgentineanArmenianAssyrian/Chaldean/SyriacAustralianAustrianBahamianBangladeshiBarbadianBasqueBelgianBelizeanBermudanBhutaneseBlackfeetBolivianBrazilianBritishBritish West IndianBulgarianBurmeseCajunCambodianCanadianCape VerdeanCarpatho RusynCelticCentral AmericanCentral American IndianCherokeeCheyenneChickasawChileanChineseChippewaChoctawColombianColvilleComancheCosta RicanCreeCreekCroatianCrowCubanCypriotCzechCzechoslovakianDanishDelawareDominicanDutchDutch West IndianEastern EuropeanEcuadorianEgyptianEnglishEstonianEthiopianEuropeanFijianFilipinoFinnishFrenchFrench American IndianFrench CanadianGermanGerman RussianGhanaianGreekGuamanian/ChamorroGuatemalanGuyaneseHaitianHmongHonduranHopiHoumaHungarianIcelanderIndian (Asian)IndonesianInupiatIranianIraqiIrishIroquoisIsraeliItalianJamaicanJapaneseJordanianKenyanKiowaKoreanLaotianLatvianLebaneseLiberianLumbeeLuxembourgerMacedonianMalaysianMalteseMarshalleseMenomineeMexicanMexican American IndianMongolianMoroccanNative HawaiianNavajoNepaleseNew ZealanderNicaraguanNigerianNorthern EuropeanNorwegianOkinawanOsageOttawaPaiutePakistaniPalestinianPanamanianParaguayanPennsylvania GermanPeruvianPimaPolishPortuguesePotawatomiPuebloPuerto RicanPuget Sound SalishRomanianRussianSalvadoranSamoanScandinavianScotch-IrishScottishSeminoleSenegaleseSerbianShoshoneSierra LeoneanSiouxSlavicSlovakSloveneSomaliSouth AfricanSouth AmericanSouth American IndianSoviet UnionSpaniardSpanishSpanish AmericanSpanish American IndianSri LankanSubsaharan AfricanSudaneseSwedishSwissSyrianTaiwaneseThaiTlingit-HaidaTohono O'OdhamTonganTrinidadian and TobagonianTsimshianTurkishU.S. Virgin IslanderUgandanUkrainianUruguayanUteVenezuelanVietnameseWelshWest IndianYakamaYaquiYugoslavianYumanYup'ikZimbabwean
Immigration
NonimmigrantsImmigrantsAfghanistanAfricaAlbaniaArgentinaArmeniaAsiaAustraliaAustriaBahamasBangladeshBarbadosBelarusBelgiumBelizeBoliviaBosnia and HerzegovinaBrazilBulgariaBurma/MyanmarCabo VerdeCambodiaCameroonCanadaCaribbeanCentral AmericaChileChinaColombiaCongoCosta RicaCroatiaCubaCzechoslovakiaDenmarkDominicaDominican RepublicEastern AfricaEastern AsiaEastern EuropeEcuadorEgyptEl SalvadorEnglandEritreaEthiopiaEuropeFijiFranceGermanyGhanaGreeceGrenadaGuatemalaGuyanaHaitiHondurasHong KongHungaryIndiaIndonesiaIranIraqIrelandIsraelItalyJamaicaJapanJordanKazakhstanKenyaKoreaKuwaitLaosLatin AmericaLatviaLebanonLiberiaLithuaniaMalaysiaMexicoMicronesiaMiddle AfricaMoldovaMoroccoNepalNetherlandsNicaraguaNigeriaNorth AmericaNorth MacedoniaNorthern AfricaNorthern EuropeNorwayOceaniaPakistanPanamaPeruPhilippinesPolandPortugalRomaniaRussiaSaudi ArabiaScotlandSenegalSerbiaSierra LeoneSingaporeSomaliaSouth AfricaSouth AmericaSouth Central AsiaSouth Eastern AsiaSouthern EuropeSpainSri LankaSt. Vincent and the GrenadinesSudanSwedenSwitzerlandSyriaTaiwanThailandTrinidad and TobagoTurkeyUgandaUkraineUruguayUzbekistanVenezuelaVietnamWest IndiesWestern AfricaWestern AsiaWestern EuropeYemenZaireZimbabweAzores
Unemployment Among Women with Children Under 6 years
Income
Poverty
Unemployment
Labor Participation
Family Structure
Vehicle Availability
Education Level
Disability

Unemployment Among Women with Children Under 6 years Comparison

Lithuanians

Hopi

Fair
Tragic
7.8%
UNEMPLOYMENT AMONG WOMEN WITH CHILDREN UNDER 6 YEARS
30.0/ 100
METRIC RATING
198th/ 347
METRIC RANK
16.8%
UNEMPLOYMENT AMONG WOMEN WITH CHILDREN UNDER 6 YEARS
0.0/ 100
METRIC RATING
344th/ 347
METRIC RANK

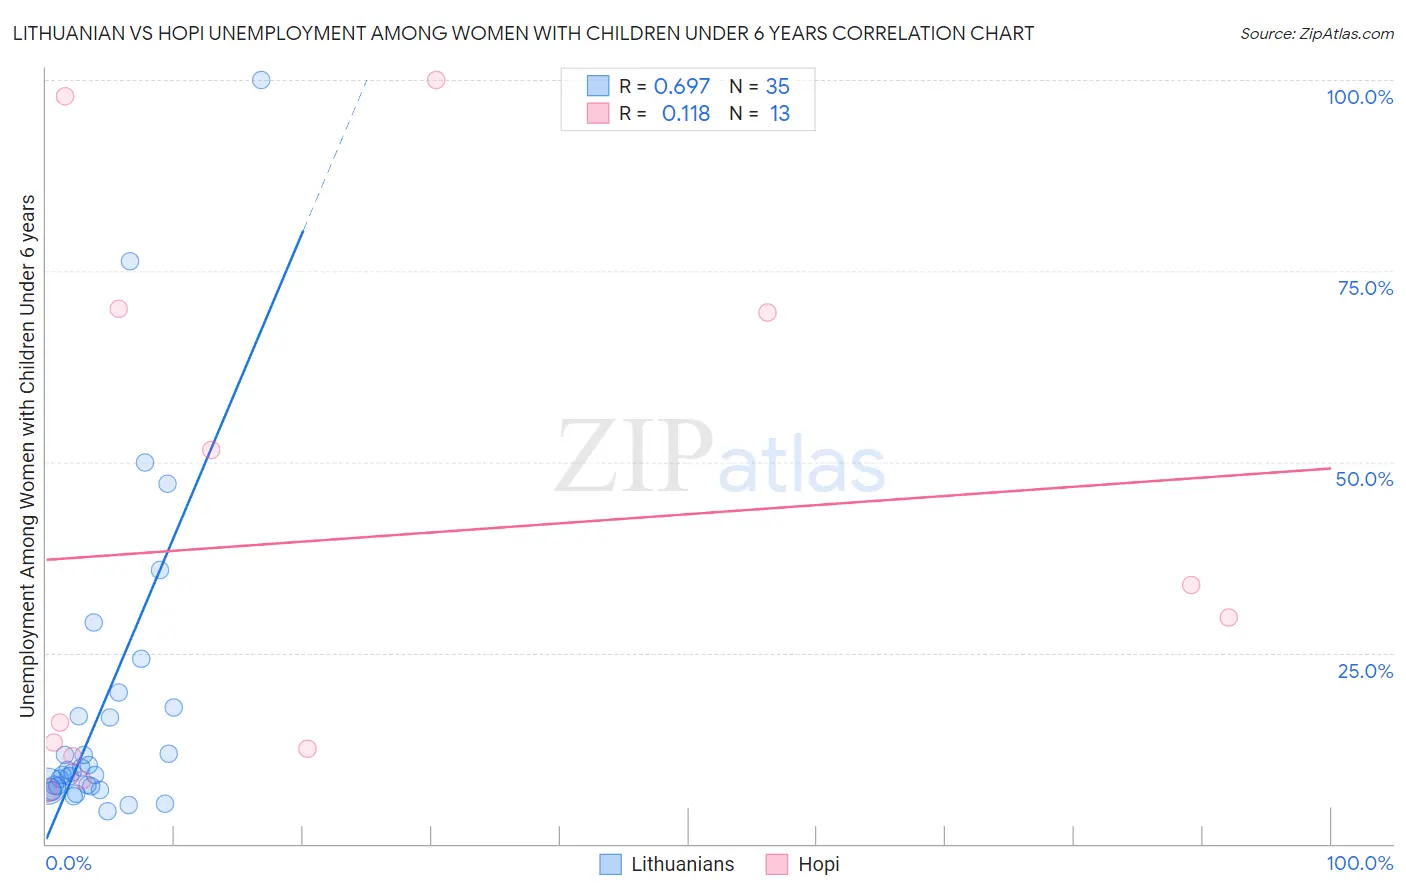
Lithuanian vs Hopi Unemployment Among Women with Children Under 6 years Correlation Chart

The statistical analysis conducted on geographies consisting of 306,238,361 people shows a significant positive correlation between the proportion of Lithuanians and unemployment rate among women with children under the age of 6 in the United States with a correlation coefficient (R) of 0.697 and weighted average of 7.8%. Similarly, the statistical analysis conducted on geographies consisting of 69,549,010 people shows a poor positive correlation between the proportion of Hopi and unemployment rate among women with children under the age of 6 in the United States with a correlation coefficient (R) of 0.118 and weighted average of 16.8%, a difference of 116.3%.
Lithuanian vs Hopi Unemployment Among Women with Children Under 6 years

Unemployment Among Women with Children Under 6 years Correlation Summary

MeasurementLithuanianHopi
Minimum4.2%7.0%
Maximum100.0%100.0%
Range95.8%93.0%
Mean18.0%40.1%
Median9.3%29.7%
Interquartile 25% (IQ1)7.5%12.0%
Interquartile 75% (IQ3)17.9%69.8%
Interquartile Range (IQR)10.4%57.8%
Standard Deviation (Sample)20.9%34.1%
Standard Deviation (Population)20.6%32.8%

Similar Demographics by Unemployment Among Women with Children Under 6 years

Demographics Similar to Lithuanians by Unemployment Among Women with Children Under 6 years

In terms of unemployment among women with children under 6 years, the demographic groups most similar to Lithuanians are Italian (7.7%, a difference of 0.030%), Immigrants from St. Vincent and the Grenadines (7.7%, a difference of 0.080%), Malaysian (7.7%, a difference of 0.090%), Syrian (7.7%, a difference of 0.15%), and Slavic (7.7%, a difference of 0.18%).
DemographicsRating | RankUnemployment Among Women with Children Under 6 years
Immigrants | Austria
32.4
/100
|
#191
Fair
7.7%
Immigrants | Africa
32.4
/100
|
#192
Fair
7.7%
Slavs
32.4
/100
|
#193
Fair
7.7%
Syrians
31.9
/100
|
#194
Fair
7.7%
Malaysians
31.1
/100
|
#195
Fair
7.7%
Immigrants | St. Vincent and the Grenadines
31.1
/100
|
#196
Fair
7.7%
Italians
30.4
/100
|
#197
Fair
7.7%
Lithuanians
30.0
/100
|
#198
Fair
7.8%
Immigrants | Poland
27.3
/100
|
#199
Fair
7.8%
Guamanians/Chamorros
25.5
/100
|
#200
Fair
7.8%
Basques
24.7
/100
|
#201
Fair
7.8%
Sudanese
23.5
/100
|
#202
Fair
7.8%
Spaniards
23.3
/100
|
#203
Fair
7.8%
Lebanese
22.2
/100
|
#204
Fair
7.8%
Immigrants | Immigrants
21.4
/100
|
#205
Fair
7.8%

Demographics Similar to Hopi by Unemployment Among Women with Children Under 6 years

In terms of unemployment among women with children under 6 years, the demographic groups most similar to Hopi are Inupiat (17.7%, a difference of 5.6%), Arapaho (19.0%, a difference of 13.5%), Crow (14.6%, a difference of 14.6%), Yuman (14.6%, a difference of 14.7%), and Lumbee (13.8%, a difference of 21.6%).
DemographicsRating | RankUnemployment Among Women with Children Under 6 years
Natives/Alaskans
0.0
/100
|
#333
Tragic
11.5%
Apache
0.0
/100
|
#334
Tragic
12.3%
Puerto Ricans
0.0
/100
|
#335
Tragic
12.5%
Shoshone
0.0
/100
|
#336
Tragic
13.2%
Chippewa
0.0
/100
|
#337
Tragic
13.3%
Pima
0.0
/100
|
#338
Tragic
13.4%
Navajo
0.0
/100
|
#339
Tragic
13.5%
Immigrants | Yemen
0.0
/100
|
#340
Tragic
13.5%
Lumbee
0.0
/100
|
#341
Tragic
13.8%
Yuman
0.0
/100
|
#342
Tragic
14.6%
Crow
0.0
/100
|
#343
Tragic
14.6%
Hopi
0.0
/100
|
#344
Tragic
16.8%
Inupiat
0.0
/100
|
#345
Tragic
17.7%
Arapaho
0.0
/100
|
#346
Tragic
19.0%
Yup'ik
0.0
/100
|
#347
Tragic
21.1%