Immigrants from Western Africa vs Hopi Unemployment Among Women with Children Under 6 years

COMPARE

Immigrants from Western Africa
Race
Ancestry
AfghanAfricanAlaska NativeAlaskan AthabascanAlbanianAleutAlsatianAmericanApacheArabArapahoArgentineanArmenianAssyrian/Chaldean/SyriacAustralianAustrianBahamianBangladeshiBarbadianBasqueBelgianBelizeanBermudanBhutaneseBlackfeetBolivianBrazilianBritishBritish West IndianBulgarianBurmeseCajunCambodianCanadianCape VerdeanCarpatho RusynCelticCentral AmericanCentral American IndianCherokeeCheyenneChickasawChileanChineseChippewaChoctawColombianColvilleComancheCosta RicanCreeCreekCroatianCrowCubanCypriotCzechCzechoslovakianDanishDelawareDominicanDutchDutch West IndianEastern EuropeanEcuadorianEgyptianEnglishEstonianEthiopianEuropeanFijianFilipinoFinnishFrenchFrench American IndianFrench CanadianGermanGerman RussianGhanaianGreekGuamanian/ChamorroGuatemalanGuyaneseHaitianHmongHonduranHoumaHungarianIcelanderIndian (Asian)IndonesianInupiatIranianIraqiIrishIroquoisIsraeliItalianJamaicanJapaneseJordanianKenyanKiowaKoreanLaotianLatvianLebaneseLiberianLithuanianLumbeeLuxembourgerMacedonianMalaysianMalteseMarshalleseMenomineeMexicanMexican American IndianMongolianMoroccanNative HawaiianNavajoNepaleseNew ZealanderNicaraguanNigerianNorthern EuropeanNorwegianOkinawanOsageOttawaPaiutePakistaniPalestinianPanamanianParaguayanPennsylvania GermanPeruvianPimaPolishPortuguesePotawatomiPuebloPuerto RicanPuget Sound SalishRomanianRussianSalvadoranSamoanScandinavianScotch-IrishScottishSeminoleSenegaleseSerbianShoshoneSierra LeoneanSiouxSlavicSlovakSloveneSomaliSouth AfricanSouth AmericanSouth American IndianSoviet UnionSpaniardSpanishSpanish AmericanSpanish American IndianSri LankanSubsaharan AfricanSudaneseSwedishSwissSyrianTaiwaneseThaiTlingit-HaidaTohono O'OdhamTonganTrinidadian and TobagonianTsimshianTurkishU.S. Virgin IslanderUgandanUkrainianUruguayanUteVenezuelanVietnameseWelshWest IndianYakamaYaquiYugoslavianYumanYup'ikZimbabwean
Immigration
NonimmigrantsImmigrantsAfghanistanAfricaAlbaniaArgentinaArmeniaAsiaAustraliaAustriaBahamasBangladeshBarbadosBelarusBelgiumBelizeBoliviaBosnia and HerzegovinaBrazilBulgariaBurma/MyanmarCabo VerdeCambodiaCameroonCanadaCaribbeanCentral AmericaChileChinaColombiaCongoCosta RicaCroatiaCubaCzechoslovakiaDenmarkDominicaDominican RepublicEastern AfricaEastern AsiaEastern EuropeEcuadorEgyptEl SalvadorEnglandEritreaEthiopiaEuropeFijiFranceGermanyGhanaGreeceGrenadaGuatemalaGuyanaHaitiHondurasHong KongHungaryIndiaIndonesiaIranIraqIrelandIsraelItalyJamaicaJapanJordanKazakhstanKenyaKoreaKuwaitLaosLatin AmericaLatviaLebanonLiberiaLithuaniaMalaysiaMexicoMicronesiaMiddle AfricaMoldovaMoroccoNepalNetherlandsNicaraguaNigeriaNorth AmericaNorth MacedoniaNorthern AfricaNorthern EuropeNorwayOceaniaPakistanPanamaPeruPhilippinesPolandPortugalRomaniaRussiaSaudi ArabiaScotlandSenegalSerbiaSierra LeoneSingaporeSomaliaSouth AfricaSouth AmericaSouth Central AsiaSouth Eastern AsiaSouthern EuropeSpainSri LankaSt. Vincent and the GrenadinesSudanSwedenSwitzerlandSyriaTaiwanThailandTrinidad and TobagoTurkeyUgandaUkraineUruguayUzbekistanVenezuelaVietnamWest IndiesWestern AfricaWestern AsiaWestern EuropeYemenZaireZimbabweAzores
Hopi
Race
Ancestry
AfghanAfricanAlaska NativeAlaskan AthabascanAlbanianAleutAlsatianAmericanApacheArabArapahoArgentineanArmenianAssyrian/Chaldean/SyriacAustralianAustrianBahamianBangladeshiBarbadianBasqueBelgianBelizeanBermudanBhutaneseBlackfeetBolivianBrazilianBritishBritish West IndianBulgarianBurmeseCajunCambodianCanadianCape VerdeanCarpatho RusynCelticCentral AmericanCentral American IndianCherokeeCheyenneChickasawChileanChineseChippewaChoctawColombianColvilleComancheCosta RicanCreeCreekCroatianCrowCubanCypriotCzechCzechoslovakianDanishDelawareDominicanDutchDutch West IndianEastern EuropeanEcuadorianEgyptianEnglishEstonianEthiopianEuropeanFijianFilipinoFinnishFrenchFrench American IndianFrench CanadianGermanGerman RussianGhanaianGreekGuamanian/ChamorroGuatemalanGuyaneseHaitianHmongHonduranHopiHoumaHungarianIcelanderIndian (Asian)IndonesianInupiatIranianIraqiIrishIroquoisIsraeliItalianJamaicanJapaneseJordanianKenyanKiowaKoreanLaotianLatvianLebaneseLiberianLithuanianLumbeeLuxembourgerMacedonianMalaysianMalteseMarshalleseMenomineeMexicanMexican American IndianMongolianMoroccanNative HawaiianNavajoNepaleseNew ZealanderNicaraguanNigerianNorthern EuropeanNorwegianOkinawanOsageOttawaPaiutePakistaniPalestinianPanamanianParaguayanPennsylvania GermanPeruvianPimaPolishPortuguesePotawatomiPuebloPuerto RicanPuget Sound SalishRomanianRussianSalvadoranSamoanScandinavianScotch-IrishScottishSeminoleSenegaleseSerbianShoshoneSierra LeoneanSiouxSlavicSlovakSloveneSomaliSouth AfricanSouth AmericanSouth American IndianSoviet UnionSpaniardSpanishSpanish AmericanSpanish American IndianSri LankanSubsaharan AfricanSudaneseSwedishSwissSyrianTaiwaneseThaiTlingit-HaidaTohono O'OdhamTonganTrinidadian and TobagonianTsimshianTurkishU.S. Virgin IslanderUgandanUkrainianUruguayanUteVenezuelanVietnameseWelshWest IndianYakamaYaquiYugoslavianYumanYup'ikZimbabwean
Immigration
NonimmigrantsImmigrantsAfghanistanAfricaAlbaniaArgentinaArmeniaAsiaAustraliaAustriaBahamasBangladeshBarbadosBelarusBelgiumBelizeBoliviaBosnia and HerzegovinaBrazilBulgariaBurma/MyanmarCabo VerdeCambodiaCameroonCanadaCaribbeanCentral AmericaChileChinaColombiaCongoCosta RicaCroatiaCubaCzechoslovakiaDenmarkDominicaDominican RepublicEastern AfricaEastern AsiaEastern EuropeEcuadorEgyptEl SalvadorEnglandEritreaEthiopiaEuropeFijiFranceGermanyGhanaGreeceGrenadaGuatemalaGuyanaHaitiHondurasHong KongHungaryIndiaIndonesiaIranIraqIrelandIsraelItalyJamaicaJapanJordanKazakhstanKenyaKoreaKuwaitLaosLatin AmericaLatviaLebanonLiberiaLithuaniaMalaysiaMexicoMicronesiaMiddle AfricaMoldovaMoroccoNepalNetherlandsNicaraguaNigeriaNorth AmericaNorth MacedoniaNorthern AfricaNorthern EuropeNorwayOceaniaPakistanPanamaPeruPhilippinesPolandPortugalRomaniaRussiaSaudi ArabiaScotlandSenegalSerbiaSierra LeoneSingaporeSomaliaSouth AfricaSouth AmericaSouth Central AsiaSouth Eastern AsiaSouthern EuropeSpainSri LankaSt. Vincent and the GrenadinesSudanSwedenSwitzerlandSyriaTaiwanThailandTrinidad and TobagoTurkeyUgandaUkraineUruguayUzbekistanVenezuelaVietnamWest IndiesWestern AsiaWestern EuropeYemenZaireZimbabweAzores
Unemployment Among Women with Children Under 6 years
Income
Poverty
Unemployment
Labor Participation
Family Structure
Vehicle Availability
Education Level
Disability

Unemployment Among Women with Children Under 6 years Comparison

Immigrants from Western Africa

Hopi

Tragic
Tragic
8.2%
UNEMPLOYMENT AMONG WOMEN WITH CHILDREN UNDER 6 YEARS
1.1/ 100
METRIC RATING
248th/ 347
METRIC RANK
16.8%
UNEMPLOYMENT AMONG WOMEN WITH CHILDREN UNDER 6 YEARS
0.0/ 100
METRIC RATING
344th/ 347
METRIC RANK

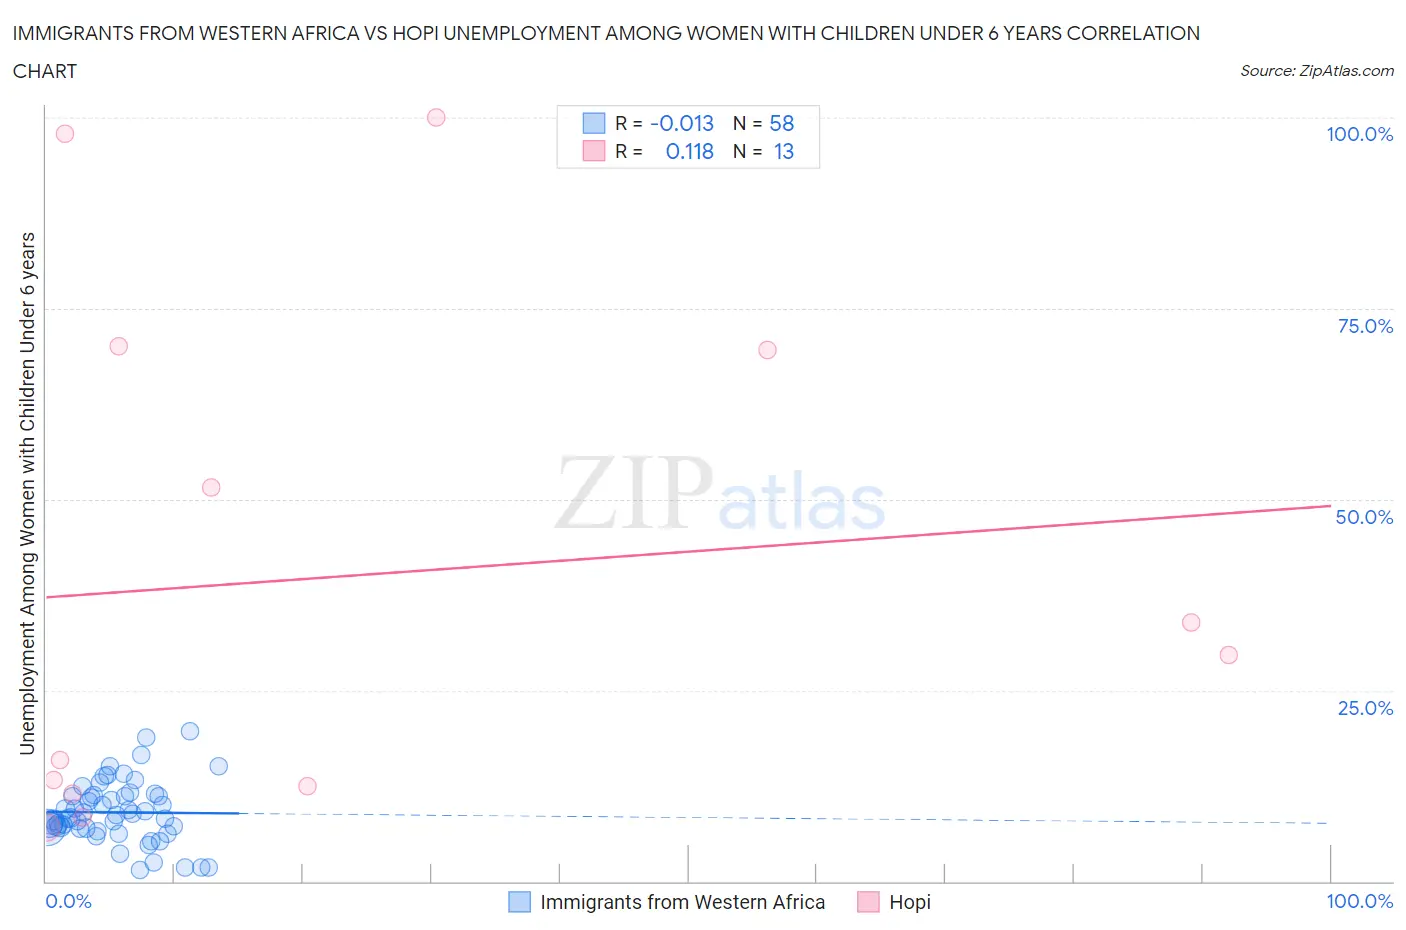
Immigrants from Western Africa vs Hopi Unemployment Among Women with Children Under 6 years Correlation Chart

The statistical analysis conducted on geographies consisting of 284,723,749 people shows no correlation between the proportion of Immigrants from Western Africa and unemployment rate among women with children under the age of 6 in the United States with a correlation coefficient (R) of -0.013 and weighted average of 8.2%. Similarly, the statistical analysis conducted on geographies consisting of 69,549,010 people shows a poor positive correlation between the proportion of Hopi and unemployment rate among women with children under the age of 6 in the United States with a correlation coefficient (R) of 0.118 and weighted average of 16.8%, a difference of 104.2%.
Immigrants from Western Africa vs Hopi Unemployment Among Women with Children Under 6 years

Unemployment Among Women with Children Under 6 years Correlation Summary

MeasurementImmigrants from Western AfricaHopi
Minimum1.4%7.0%
Maximum19.6%100.0%
Range18.2%93.0%
Mean9.0%40.1%
Median8.5%29.7%
Interquartile 25% (IQ1)7.0%12.0%
Interquartile 75% (IQ3)11.2%69.8%
Interquartile Range (IQR)4.2%57.8%
Standard Deviation (Sample)4.0%34.1%
Standard Deviation (Population)3.9%32.8%

Similar Demographics by Unemployment Among Women with Children Under 6 years

Demographics Similar to Immigrants from Western Africa by Unemployment Among Women with Children Under 6 years

In terms of unemployment among women with children under 6 years, the demographic groups most similar to Immigrants from Western Africa are German Russian (8.2%, a difference of 0.040%), Immigrants from Sierra Leone (8.2%, a difference of 0.090%), Nigerian (8.2%, a difference of 0.10%), Guyanese (8.2%, a difference of 0.27%), and Ghanaian (8.2%, a difference of 0.27%).
DemographicsRating | RankUnemployment Among Women with Children Under 6 years
Liberians
2.6
/100
|
#241
Tragic
8.1%
Dutch
2.5
/100
|
#242
Tragic
8.1%
Hawaiians
1.8
/100
|
#243
Tragic
8.2%
French
1.7
/100
|
#244
Tragic
8.2%
Native Hawaiians
1.7
/100
|
#245
Tragic
8.2%
Central Americans
1.4
/100
|
#246
Tragic
8.2%
German Russians
1.2
/100
|
#247
Tragic
8.2%
Immigrants | Western Africa
1.1
/100
|
#248
Tragic
8.2%
Immigrants | Sierra Leone
1.1
/100
|
#249
Tragic
8.2%
Nigerians
1.1
/100
|
#250
Tragic
8.2%
Guyanese
1.0
/100
|
#251
Tragic
8.2%
Ghanaians
1.0
/100
|
#252
Tragic
8.2%
Immigrants | Guyana
0.8
/100
|
#253
Tragic
8.2%
Immigrants | Caribbean
0.7
/100
|
#254
Tragic
8.3%
Immigrants | Portugal
0.6
/100
|
#255
Tragic
8.3%

Demographics Similar to Hopi by Unemployment Among Women with Children Under 6 years

In terms of unemployment among women with children under 6 years, the demographic groups most similar to Hopi are Inupiat (17.7%, a difference of 5.6%), Arapaho (19.0%, a difference of 13.5%), Crow (14.6%, a difference of 14.6%), Yuman (14.6%, a difference of 14.7%), and Lumbee (13.8%, a difference of 21.6%).
DemographicsRating | RankUnemployment Among Women with Children Under 6 years
Natives/Alaskans
0.0
/100
|
#333
Tragic
11.5%
Apache
0.0
/100
|
#334
Tragic
12.3%
Puerto Ricans
0.0
/100
|
#335
Tragic
12.5%
Shoshone
0.0
/100
|
#336
Tragic
13.2%
Chippewa
0.0
/100
|
#337
Tragic
13.3%
Pima
0.0
/100
|
#338
Tragic
13.4%
Navajo
0.0
/100
|
#339
Tragic
13.5%
Immigrants | Yemen
0.0
/100
|
#340
Tragic
13.5%
Lumbee
0.0
/100
|
#341
Tragic
13.8%
Yuman
0.0
/100
|
#342
Tragic
14.6%
Crow
0.0
/100
|
#343
Tragic
14.6%
Hopi
0.0
/100
|
#344
Tragic
16.8%
Inupiat
0.0
/100
|
#345
Tragic
17.7%
Arapaho
0.0
/100
|
#346
Tragic
19.0%
Yup'ik
0.0
/100
|
#347
Tragic
21.1%