Lebanese vs Immigrants from Bolivia Unemployment Among Seniors over 65 years
COMPARE
Lebanese
Immigrants from Bolivia
Unemployment Among Seniors over 65 years
Unemployment Among Seniors over 65 years Comparison
Lebanese
Immigrants from Bolivia
4.7%
UNEMPLOYMENT AMONG SENIORS OVER 65 YEARS
100.0/ 100
METRIC RATING
19th/ 347
METRIC RANK
5.0%
UNEMPLOYMENT AMONG SENIORS OVER 65 YEARS
97.3/ 100
METRIC RATING
91st/ 347
METRIC RANK
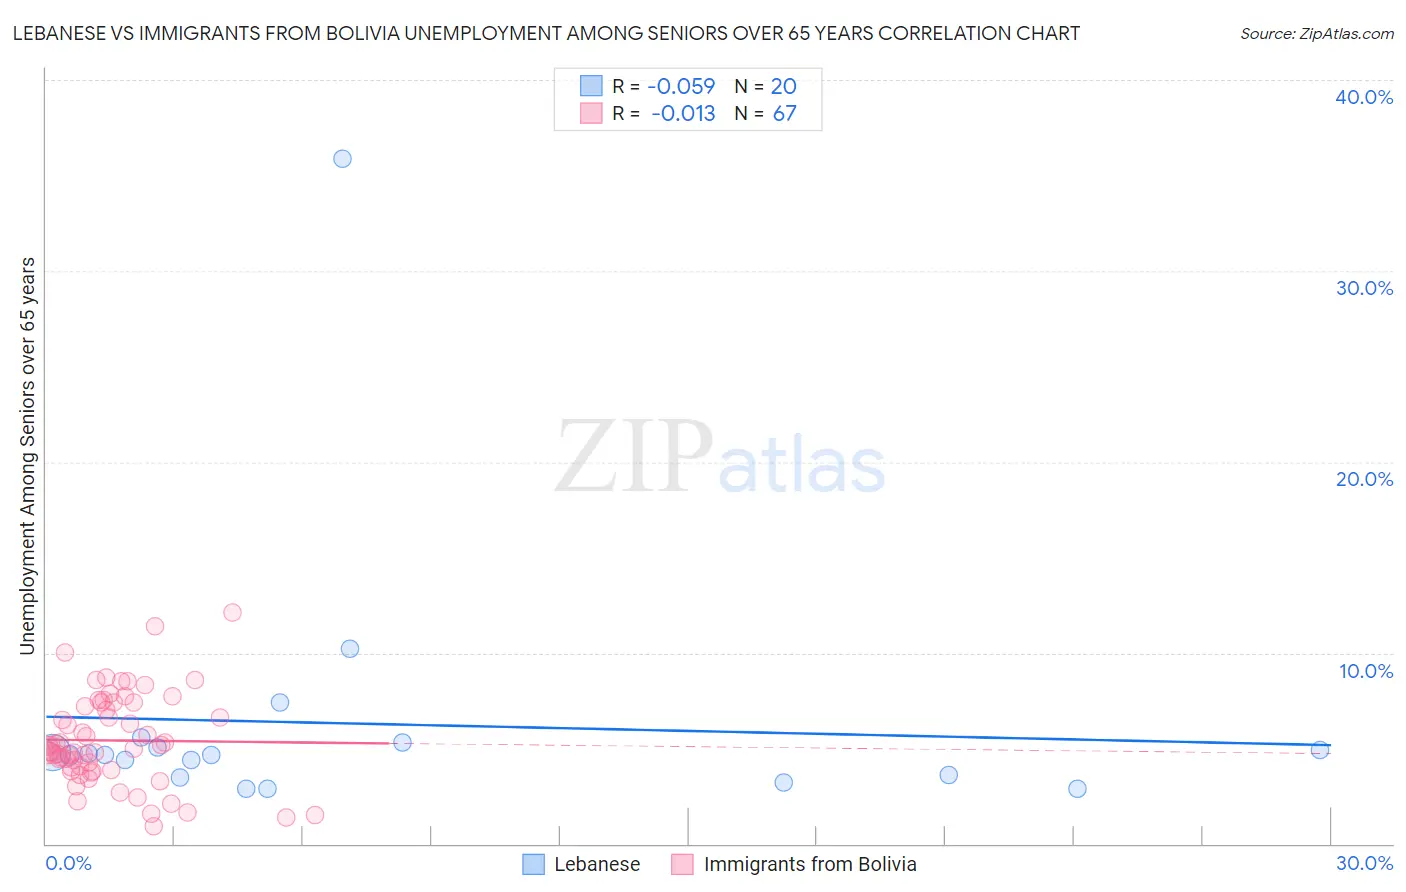
Lebanese vs Immigrants from Bolivia Unemployment Among Seniors over 65 years Correlation Chart
The statistical analysis conducted on geographies consisting of 361,576,671 people shows a slight negative correlation between the proportion of Lebanese and unemployment rate amomg seniors over the age of 65 in the United States with a correlation coefficient (R) of -0.059 and weighted average of 4.7%. Similarly, the statistical analysis conducted on geographies consisting of 152,035,484 people shows no correlation between the proportion of Immigrants from Bolivia and unemployment rate amomg seniors over the age of 65 in the United States with a correlation coefficient (R) of -0.013 and weighted average of 5.0%, a difference of 6.8%.
Unemployment Among Seniors over 65 years Correlation Summary
| Measurement | Lebanese | Immigrants from Bolivia |
| Minimum | 2.9% | 0.90% |
| Maximum | 35.9% | 12.1% |
| Range | 33.0% | 11.2% |
| Mean | 6.3% | 5.4% |
| Median | 4.6% | 5.0% |
| Interquartile 25% (IQ1) | 3.5% | 3.9% |
| Interquartile 75% (IQ3) | 5.2% | 7.4% |
| Interquartile Range (IQR) | 1.6% | 3.5% |
| Standard Deviation (Sample) | 7.2% | 2.4% |
| Standard Deviation (Population) | 7.0% | 2.3% |
Similar Demographics by Unemployment Among Seniors over 65 years
Demographics Similar to Lebanese by Unemployment Among Seniors over 65 years
In terms of unemployment among seniors over 65 years, the demographic groups most similar to Lebanese are Immigrants from Nepal (4.7%, a difference of 0.0%), Norwegian (4.7%, a difference of 0.23%), Czech (4.7%, a difference of 0.41%), Immigrants from Eritrea (4.7%, a difference of 0.59%), and Kenyan (4.7%, a difference of 0.83%).
| Demographics | Rating | Rank | Unemployment Among Seniors over 65 years |
| Osage | 100.0 /100 | #12 | Exceptional 4.6% |
| Cubans | 100.0 /100 | #13 | Exceptional 4.6% |
| Menominee | 100.0 /100 | #14 | Exceptional 4.6% |
| Lumbee | 100.0 /100 | #15 | Exceptional 4.6% |
| Immigrants | Burma/Myanmar | 100.0 /100 | #16 | Exceptional 4.6% |
| Creek | 100.0 /100 | #17 | Exceptional 4.6% |
| Immigrants | Eritrea | 100.0 /100 | #18 | Exceptional 4.7% |
| Lebanese | 100.0 /100 | #19 | Exceptional 4.7% |
| Immigrants | Nepal | 100.0 /100 | #20 | Exceptional 4.7% |
| Norwegians | 100.0 /100 | #21 | Exceptional 4.7% |
| Czechs | 100.0 /100 | #22 | Exceptional 4.7% |
| Kenyans | 100.0 /100 | #23 | Exceptional 4.7% |
| Iraqis | 100.0 /100 | #24 | Exceptional 4.7% |
| Tongans | 100.0 /100 | #25 | Exceptional 4.7% |
| Immigrants | Lebanon | 100.0 /100 | #26 | Exceptional 4.8% |
Demographics Similar to Immigrants from Bolivia by Unemployment Among Seniors over 65 years
In terms of unemployment among seniors over 65 years, the demographic groups most similar to Immigrants from Bolivia are Immigrants from Bulgaria (5.0%, a difference of 0.020%), Austrian (5.0%, a difference of 0.020%), Immigrants from South Africa (5.0%, a difference of 0.080%), Immigrants from South Central Asia (5.0%, a difference of 0.090%), and Afghan (5.0%, a difference of 0.10%).
| Demographics | Rating | Rank | Unemployment Among Seniors over 65 years |
| Filipinos | 98.3 /100 | #84 | Exceptional 5.0% |
| Immigrants | Hungary | 98.2 /100 | #85 | Exceptional 5.0% |
| Immigrants | Taiwan | 98.2 /100 | #86 | Exceptional 5.0% |
| Immigrants | Switzerland | 98.2 /100 | #87 | Exceptional 5.0% |
| Afghans | 97.6 /100 | #88 | Exceptional 5.0% |
| Immigrants | South Central Asia | 97.6 /100 | #89 | Exceptional 5.0% |
| Immigrants | South Africa | 97.6 /100 | #90 | Exceptional 5.0% |
| Immigrants | Bolivia | 97.3 /100 | #91 | Exceptional 5.0% |
| Immigrants | Bulgaria | 97.3 /100 | #92 | Exceptional 5.0% |
| Austrians | 97.3 /100 | #93 | Exceptional 5.0% |
| Burmese | 96.8 /100 | #94 | Exceptional 5.0% |
| Assyrians/Chaldeans/Syriacs | 96.8 /100 | #95 | Exceptional 5.0% |
| Immigrants | Singapore | 96.8 /100 | #96 | Exceptional 5.0% |
| Immigrants | Oceania | 96.8 /100 | #97 | Exceptional 5.0% |
| Czechoslovakians | 96.7 /100 | #98 | Exceptional 5.0% |